
Fig. 5
- ID
- ZDB-FIG-200506-9
- Publication
- Aramaki et al., 2018 - Method for disarranging the pigment pattern of zebrafish by optogenetics
- Other Figures
- All Figure Page
- Back to All Figure Page
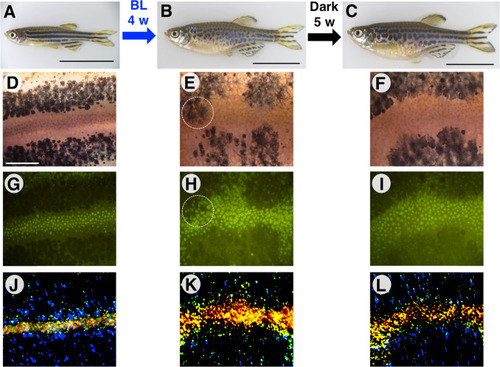
Forced melanophore migration resets the established stripe pattern. (A) mitfa:ChR2(C128S/D156A) stable transgenic fish were reared in the dark until 6.5 wpf. A well-established stripe pattern is shown. 16.5 mm SL. (B) The same transgenic fish were irradiated with BL for 4 weeks, disrupting the stripe pattern. 24.0 mm SL. (C) Five weeks after the fish was returned to the dark, a stripe pattern regenerated that was partly lacking horizontal directionality. 25.0 mm SL. (D–F) Bright-field images of melanophores. (G–I) Green autofluorescence of xanthophores in fluorescence images. (J–L) Light reflection from iridophores in dark-field images. Yellow indicates dense iridophores and blue indicates loose, dispersed iridophores. The three pigment cell types were rearranged after BL irradiation. Black scale bar, 10 mm; white scale bar, 500 µm. Magnified images of the regions surrounded by white-dashed lines are shown in Supplementary Fig. S6. |
Reprinted from Developmental Biology, 460(1), Aramaki, T., Kondo, S., Method for disarranging the pigment pattern of zebrafish by optogenetics, 12-19, Copyright (2018) with permission from Elsevier. Full text @ Dev. Biol.