|
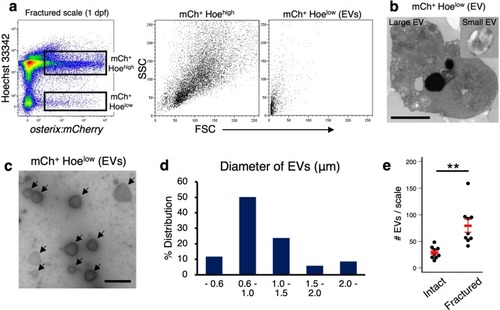
Isolation of OB-derived EVs.a Representative flow cytometric analysis of cells in fractured scales at 1 day post-fracture (dpf) from an osterix:mCherry single-transgenic zebrafish. Gated regions in the left panel indicate the osterix:mCherry+ Hoecht 33342high (mCh+ Hoehigh) cell fraction and mCh+ Hoelow EV fraction. mCh+ Hoehigh cells and mCh+ Hoelow EVs are displayed in a forward scatter (FSC) vs. side scatter (SSC) dot plot (middle and right panels, respectively). b Representative electron microscopic images of isolated large and small EVs. c Representative image of isolated EVs negatively stained. Arrows indicate an EV. d Percent size distribution of EVs (n = 223). e Absolute number of mCh+ Hoelow EVs in an intact and fractured scale at 1 dpf. **p < 0.01 (n = 9 for each group). Bars, 1 μm b; 2 μm c. Experiments were performed twice with two biological replicates a–d and nine biological replicates e in each group.
|