|
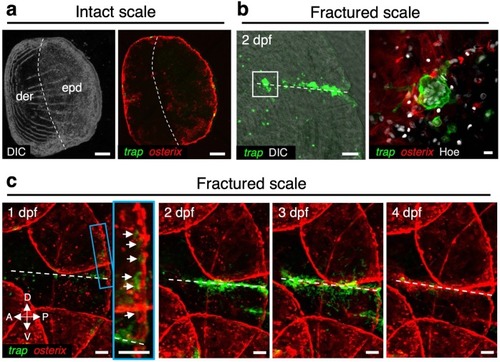
<italic>trap:GFP</italic><sup>+</sup> cells converged at the fracture site in the zebrafish scale.a, b Representative images of an intact a or fractured scale b in trap:GFP; osterix:mCherry double-transgenic zebrafish. Dotted lines in a show a boundary of the dermis (der) and epidermis (epd) area. The right panel in b shows a high magnification view of the white boxed area in the left panel. c Representative time-course changes of a fractured scale. The inset in the left panel shows a high magnification view of the blue boxed area. Images are orientated with the dorsal side to the top and anterior side to the left. Arrows indicate trap:GFP+ cells observed in the edge area of the fractured scale. Dotted lines in b and c show the fracture site. DIC differential interference contrast. Hoe Hoechst 33342; dpf days post-fracture; bars, 200 μm a; 10 μm (right panel in b); 100 μm (left panel in b, c). Experiments were performed twice with three biological replicates in each group a–c.
|