
Fig. 2
- ID
- ZDB-FIG-200422-6
- Publication
- Mackin et al., 2019 - Endocrine regulation of multichromatic color vision
- Other Figures
- All Figure Page
- Back to All Figure Page
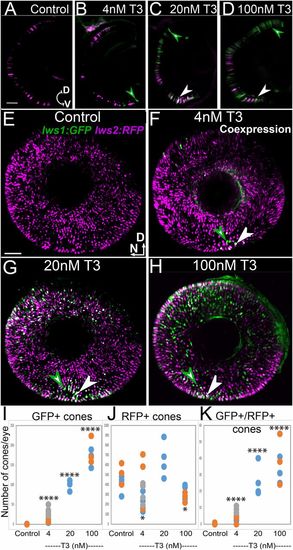
Lws reporter transgenic indicates a switch from lws2 to lws1 in response to TH (T3). (A–D) Cryosections from 4 dpf lws:PAC(H) eyes treated with DMSO (control; A), 4 nM T3 (B), 20 nM T3 (C), 100 nM T3 (D). (E–H) Whole-mounted lws:PAC(H) eyes visualized by confocal microscopy of DMSO (control) (E), 4 nM T3 (F), 20 nM T3 (G), 100 nM T3 (H). Green arrowheads indicate GFP+ cones, white arrowheads indicate colabeled cones. RFP is pseudocolored magenta. D, dorsal; N, nasal; V, ventral. (Scale bars in A [applies to A–D] and E [applies to E–H], 50 μm.) (I–K) GFP+ cone numbers, 4 nM T3 P = 1.28e-07, 20 nM T3 P = 2.47e-10, 100 nM T3 P = 4.46e-14 (I). RFP+ cones 4 nM T3 P = 0.022, 20 nM T3 P = 0.25, 100 nM T3 P = 0.03 (J) and (K) GFP+/RFP+ cone numbers, 4 nM T3 P = 2.3e-05, 20 nM T3 P = 9.8e-09, 100 nM T3 P = 4.0e-11 from 3 z-projected images from whole mounts of each condition show a dose-dependent increase in GFP-expressing (lws1+) cones. Colors of dots correspond to separate experiments. Each dot represents a biological replicate (an individual larva). P values were calculated by comparing the number of GFP+ or GFP+RFP+ cones for treated vs. control from each experiment using the Kruskal–Wallis test and the Conover post hoc test further adjusted by the Benjamini–Hochberg false-discovery rate method. Statistical notation: *P < 0.05, ****P < 0.0001. |