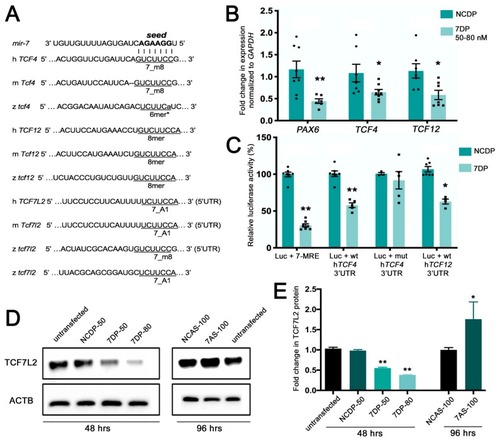
miR-7 negatively regulates TCF7L2, encoding the Wnt/β-catenin transducer, and the basic helix–loop–helix (bHLH) genes TCF4 and TCF12. (A) Various seed match regions (7_m8, 6mer*, or 8mer types) for miR-7 are detectable in the human (h), mouse (m), and zebrafish (z) 3′UTRs of Tcf4 and Tcf12 transcripts. A seed match region for miR-7 is detectable in the 5′UTR of Tcf7l2 transcripts in the three species; an additional 7_A1 seed region is detectable in the 3′UTR of the zebrafish tcf7l2 transcript. (B) TCF4 and TCF12 are down regulated by miR-7, following miR-7 over-expression (miR-7 duplex (7DP)). PAX6 is used as a positive control being a known target of miR-7. Normalization was done to GAPDH and presented as fold change ± SEM (n ≥ 3) relative to the expression of control duplex NCDP; (*) p < 0.05 and (**) p < 0.01. (C) Luciferase reporter assay: the 3′UTR region of TCF12 and the 3′UTR of b-fragment of TCF4 were cloned downstream of the Renilla luciferase gene in the psiCheck2 vector. Repression of the luciferase activity was observed for miR-7 miRNA response element (MRE) (75%), TCF4 3′UTR (40%), and TCF12 3′UTR (~40%). Every Renilla luciferase reading was normalized to that of the control firefly luciferase. The luciferase activities of miR-7 transfected cells were presented as percentage relative to the level of luciferase in NCDP transfected cells (this control luciferase level is considered as 100%). The values represent average ± SEM (n ≥ 8). Two-tail t-test results are indicated by (**) p < 0.01 and (*) p < 0.05, relative to NCDP. (D) miR-7 represses the endogenous TCF7L2 protein levels in neural progenitor cells 48 h after transfection with 7DP at two tested doses: 50 nM and 80 nM (control duplex: NCDP50). Antisense down-regulation of miR-7 (7AS-100) leads to increased levels of TCF7L2 protein, compared with control antisense (NCAS-100) and untransfected controls (analysis at 96 h after transfection). (E) The TCF7L2 protein levels were quantified from the Western blot bands, normalized to the β-actin (ACTB) levels and presented as fold change ± SEM (n ≥ 3). Two tailed t-tests are indicated by (*) p < 0.05 and (**) p < 0.01.
|
