|
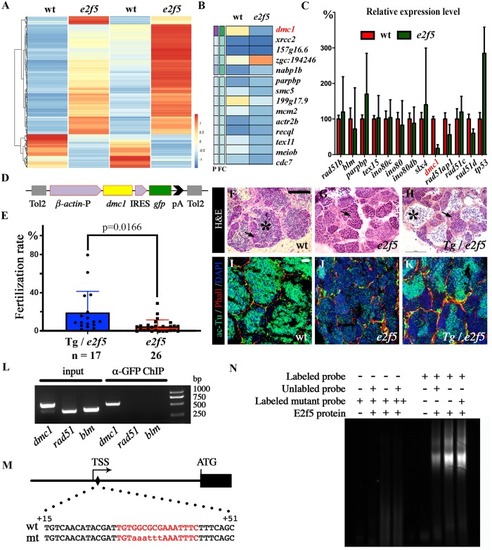
E2f5 binds to the promoter of <italic>dmc1</italic>.(A) Heat map of RNA-seq transcriptome analysis from two sets of wild-type and mutant testes. (B) Expression heat map of genes involved in homologous recombination in wild-type and e2f5 mutants. The full list of genes analyzed is listed in S2A Fig. (C) qRT-PCR results showing the relative expression level of genes involved in homologous recombination in wild-type and e2f5 mutant testes. The expression of each gene in wild-type testes was set as 100%. The full list of genes analyzed is listed in S2B Fig. (D) Diagram of the construct used for generating Tg(β-actin:dmc1) transgenic fish. (E) Dot plot showing the fertilization rate of e2f5 mutants carrying the Tg(β-actin:dmc1) transgene. (F-H) H&E staining results showing testes from wild-type, e2f5 mutant and e2f5 mutant carrying Tg(β-actin:dmc1) transgene. Asterisks indicate mature spermatozoa. Arrows indicate spermatocytes. (I-K) Confocal images showing the staining of sperm flagella visualized with an anti-acetylated tubulin antibody in green in wild-type and mutant testes as indicated. Nuclei and actin filaments were counterstained with DAPI (blue) and phalloidin (red) respectively. (L) CHIP analysis of GFP-E2f5 binding to the promoter of dmc1. (M) Diagram showing the position and sequence of potential E2f5 binding site near the transcription start site (TSS) of the dmc1 gene. (N) EMSA analysis of the interaction between E2f5 protein and oligonucleotide probes corresponding to the wild-type and mutant E2F binding sites as indicated in panel M. “++” indicates that the amount of probes was doubled than those in other parallel experiments (+). Scale bars: 100 μm in panel F-H and 25 μm in panel I-K.
|