
Figure 4
- ID
- ZDB-FIG-200406-277
- Publication
- Mateus et al., 2020 - BMP Signaling Gradient Scaling in the Zebrafish Pectoral Fin
- Other Figures
- All Figure Page
- Back to All Figure Page
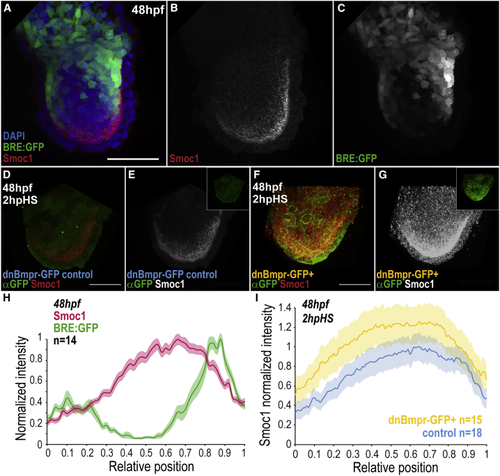
Smoc1 Is Repressed by BMP Signaling (A–C) BRE:GFP signal (green) and Smoc1 immunostaining (red) in the fin, at 48 hpf. (D–G) Smoc1 expression pattern at 2 h post-heat-shock induction (hpHS) of a dominant-negative BMP receptor transgene (dnBmpr-GFP+) or in sibling controls (for heat-shock conditions, see (H) Average intensities of normalized Smoc1 immunostainings and BRE:GFP signal versus relative position (ROI midline), at 48 hpf. Intensities were normalized to respective maxima. (I) Average intensity of normalized Smoc1 immunostainings versus relative position (ROI midline) in dnBmpr-GFP+ transgenics and siblings control. Smoc1 intensity in dnBmpr-GFP+ was normalized to the control maxima. Shadowing corresponds to SEM per relative position (H, I). Scale bars, 50 μm. n represents number of fins analyzed. Anterior, left; distal, down. BRE:GFP transgene used: BRE:eGFP ( |
| Gene: | |
|---|---|
| Fish: | |
| Anatomical Term: | |
| Stage: | Long-pec |