
Figure 3
- ID
- ZDB-FIG-200406-276
- Publication
- Mateus et al., 2020 - BMP Signaling Gradient Scaling in the Zebrafish Pectoral Fin
- Other Figures
- All Figure Page
- Back to All Figure Page
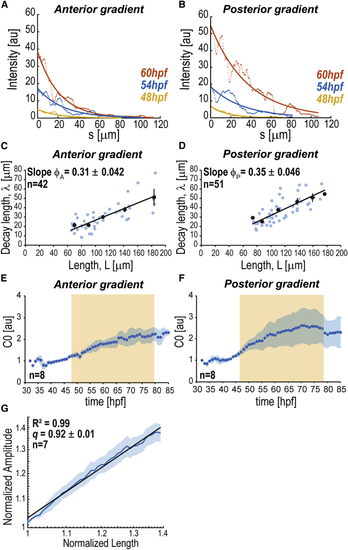
Scaling of BMP Signaling Gradients (A and B) BRE:GFP gradients at different times as a function of the distance to intensity maxima ( (C and D) Decay length versus ROI half-length (E and F) Average dynamics of gradient amplitude ( (G) Log-log plot of normalized average amplitude Shadowing corresponds to SEM per time point (E, F) or length (G). n represents number of fins analyzed. BRE:GFP transgene used: BRE:eGFP ( |