FIGURE

Fig. 4.

ID
ZDB-FIG-200325-148
Publication
McGuirl et al., 2020 - Topological data analysis of zebrafish patterns
Other Figures
All Figure Page
Back to All Figure Page
Fig. 4.

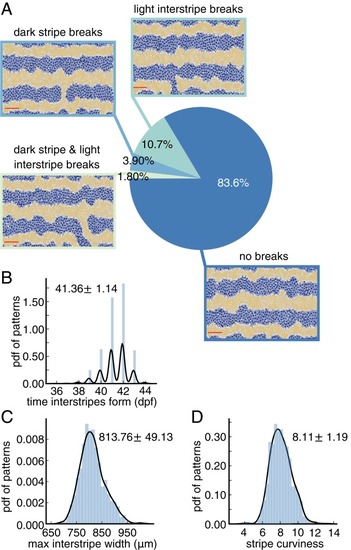
Baseline quantification of wild-type patterns. All measurements are based on 1,000 simulations of the model (20) under the default parameter regime. (A) We use persistent homology to detect the presence of breaks in stripes and interstripes. (Following the example in ref. 20, we do not count breaks in the dark stripes along the top and bottom boundaries of the domain.) The domain captures about one-third of the fish body (20). (B) Distribution of times at which interstripes X1D and X1V (Fig. 1F) begin to form. (C) Distribution of maximum interstripe width. (D) Distribution of stripe curviness (also see Fig. 3C). In B–D, we display histograms of in silico data and kernel density estimator (KDE) curves with a Gaussian kernel in black; the mean plus/minus the SD is shown in each plot for the data.

Expression Data

Expression Detail
Antibody Labeling
Phenotype Data

Phenotype Detail
Acknowledgments
This image is the copyrighted work of the attributed author or publisher, and ZFIN has permission only to display this image to its users. Additional permissions should be obtained from the applicable author or publisher of the image. Full text @ Proc. Natl. Acad. Sci. USA