|
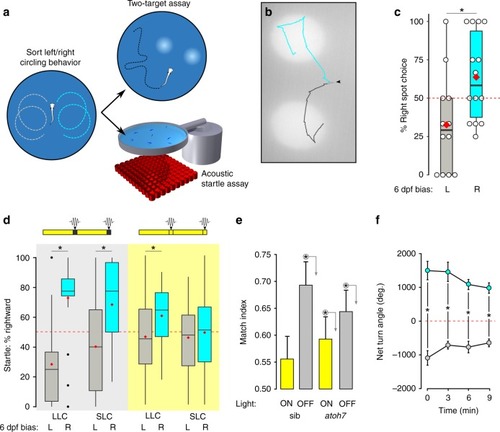
Motor asymmetry is correlated across multiple behavioral tasks.a Experimental paradigm: larvae were classified as left-/right-biased at 6 dpf based on circling response after loss of illumination (over 4 trials). At 7 dpf, the same larvae were tested in either a two-target phototaxis assay or acoustic startle assay. b Representative path trajectories for right- (cyan) and left- (gray) classified larvae (arrowhead) presented with two symmetric light spots following loss of illumination. c Percent of trials on which larvae turned toward the right spot, for larvae classified at 6 dpf as left-biased (gray, N = 12) and right-biased (cyan bar, N = 13). Each larva performed four trials, with trials excluded if the larva was adjacent to the arena edge when light spots were presented. Asterisk p < 0.05, r = 0.51, Mann–Whitney U test. d Percentage of startle responses made in a rightward direction for larvae preclassified as left- (gray) or right- (cyan) biased. Larvae were tested either in the dark (gray background) or light (yellow background) conditions. As acoustic stimuli elicit either short- or long-latency C starts (SLC, LLC) that are mediated by different circuits, response types were analyzed separately. Red diamond indicates mean. Dark LLC responses: left N = 19, right N = 20. Dark SLC responses: left N = 12, right N = 14; light LLC responses: left N = 27, right N = 23; light SLC responses: left N = 18, right N = 28. Asterisk p < 0.05, r = 0.71, 0.51, and 0.35, respectively, Mann–Whitney U test. e Match index for atoh7 mutants and siblings during baseline illumination (sib, N = 45; mutant, N = 57; yellow bars) and dark conditions (sib, N = 51; mutant, N = 58; gray bars). Asterisk p < 0.05, r = 0.74, 0.20, and 0.41, respectively, one-sample permutation test to 0.5. f NTA for each of four trials after unilateral enucleation of the left (gray, N = 4) or right (cyan, N = 6) eye. Dotted red line: random output. Repeated measures ANOVA, the effect of side-lesioned, F1,7 = 115.8, p < 0.001, η2p = 0.94. Asterisk p < 0.05 between groups. Error bars represent standard error of the mean. Box plots show median and quartiles with whiskers indicating 10–90%. Source data are provided as a Source Data file.
|