
FIGURE
Figure 2
- ID
- ZDB-FIG-200306-21
- Publication
- Wang et al., 2020 - Evaluation of the Developmental Toxicity Induced by E804 in Zebrafish Embryos
- Other Figures
- All Figure Page
- Back to All Figure Page
Figure 2
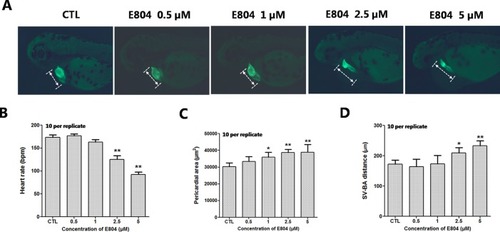
Effects of E804 on developing heart (n = 3 replicates, 10 per replicate). |
Expression Data
Expression Detail
Antibody Labeling
Phenotype Data
Phenotype Detail
Acknowledgments
This image is the copyrighted work of the attributed author or publisher, and
ZFIN has permission only to display this image to its users.
Additional permissions should be obtained from the applicable author or publisher of the image.
Full text @ Front Pharmacol