FIGURE SUMMARY
Title

Evaluation of the Developmental Toxicity Induced by E804 in Zebrafish Embryos

Authors
Wang, R., Liu, K., Zhang, Y., Chen, X., Wang, X.
Source
Full text @ Front Pharmacol

Developmental toxicity of E804 in zebrafish larvae (n = 3 replicates, N = 3 biological replicates, 90 embryos per replicate). (A) Lethal rate at 96 hpf (F = 52.3, df = 35) (B) Malformation rates at 96 hpf (F = 74.4, df = 35). (C) Hatching rates at 72 hpf (F = 7.68, df = 35). (D) Body length at 96 hpf (F = 56.72, df = 59). (E) The phenotypic changes of embryos at 24, 48, 72, and 96 hpf. The values are expressed as mean ± SD (n = 3). *Represents p-value less than 0.05 and **represents p-value less than 0.01. df means the degrees of freedom, F means F-distribution.

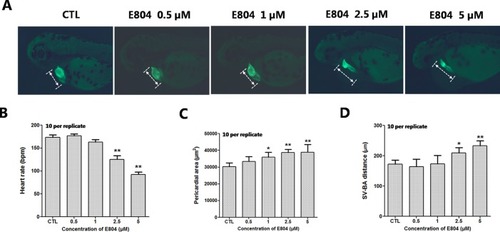
Effects of E804 on developing heart (n = 3 replicates, 10 per replicate). (A) Phenotypes of larvae of Tg(cmlc2:EGFP) lines. SV-BA distance is indicated by white row. (B) Heart rates at 72 hpf (F = 37.63, df = 29). (C) Pericardial area at 72 hpf (F = 24.62, df = 49). (D) SV-BA distance at 72 hpf (F = 19.53, df = 49). The values are expressed as mean ± SD (n = 3). *Represents p-value less than 0.05 and **represents p-value less than 0.01.

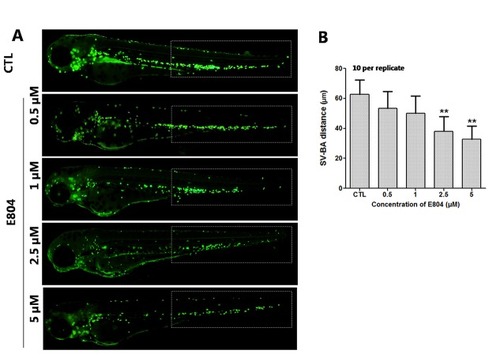
Effects of E804 on angiogenesis (n = 3 replicates, 10 embryos per replicate). (A) Phenotype of larvae of Tg(fli-1:EGFP) lines. The ISVs were counted and analyzed in white box regions. (B) The number of the ISVs at 48 hpf (F = 91.86, df = 49). (C) The total length of the ISVs at 48 hpf (F = 53.5, df = 49). The values are expressed as mean ± SD (n = 3). *Represents p-value less than 0.05 and **represents p-value less than 0.01.

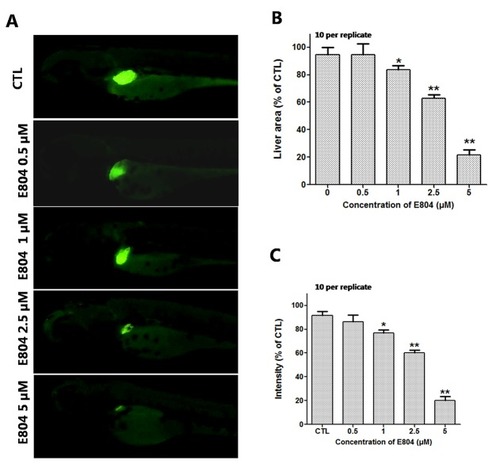
Effects of E804 on developing liver (n = 3 replicates, 10 embryos per replicate). (A) Phenotypes of larvae of Tg(L-FABP : EGFP) lines. (B) Liver area at 96 hpf (F = 24.62, df = 49). (C) Liver intensity at 96 hpf (F = 125, df = 54). The values are expressed as mean ± SD (n = 3). *Represents p-value less than 0.05 and **represents p-value less than 0.01.

Effects of E804 on the macrophage and neutrophil (n = 3 replicates, 10 embryos per replicate). (A) Phenotypes of larvae of Tg(Lyz : EGFP) lines. The total number of macrophage and neutrophil was counted in white box regions. (B) Total number of macrophage and neutrophil in larvae at 72 hpf (F = 14.12, df = 49). The values are expressed as mean ± SD (n = 3). **Represents p-value less than 0.01.

Effects of E804 on the ROS and apoptosis (n = 3 replicates, 10 embryos per replicate). (A) Fluorescence micrographs of ROS generation in zebrafish larvae at 72 hpf. (B) Quantitative analysis of ROS generation (F = 26.87, df = 49). (C) AO staining of the apoptotic cells. (White arrows indicate apoptotic cells in heart). (D) Quantitative analysis of the apoptotic cells (F = 47.21, df = 49). The values are expressed as mean ± SD (n = 3). **Represents p–value less than 0.01.

Effects of E804 on activities of SOD and the content of MDA in zebrafish at 72 hpf (n = 3 replicates, 50 embryos per replicate). (A) SOD activities (F = 14.55, df = 14). (B) MDA content (F = 27.18, df = 19). The values are expressed as mean ± SD. *Represents p-value less than 0.05 and **represents p-value less than 0.01.

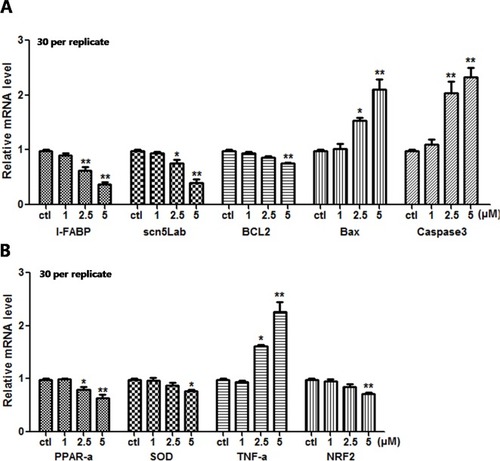
Effects of E804 on gene expression at 96 hpf (n = 3, 30 embryos per replicate). The mRNA expression level of L-FABP, scn5Lab, BCL2, Bax, Caspase 3 (A), PPAR-α, SOD, TNF-α, and NRF-2 (B). The values are expressed as mean ± SD (F = 35.97, df = 14). *Represents p-value less than 0.05 and **represents p-value less than 0.01.

Acknowledgments
This image is the copyrighted work of the attributed author or publisher, and ZFIN has permission only to display this image to its users. Additional permissions should be obtained from the applicable author or publisher of the image. Full text @ Front Pharmacol