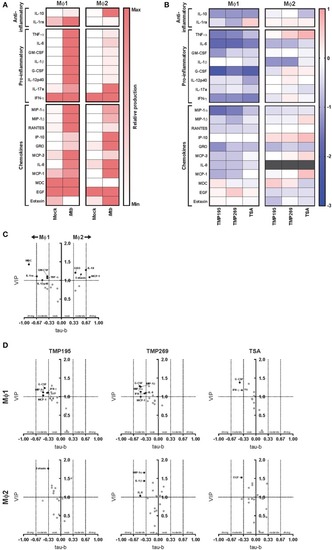
Exposure to low concentrations HDAC inhibitors during monocyte differentiation alters the cytokine/chemokine response of Mϕ1 and Mϕ2 upon Mtb infection. (A) Heat map displaying median cytokine/chemokine expression levels (of 4 different donors) in supernatants of standardly differentiated Mϕ1 and Mϕ2 24 h following Mtb or mock infection. Each row represents the relative expression of the indicated cytokine/chemokine using a white to red color scale. Of the 41 analytes measured, only cytokines/chemokines that changed in at least 3 out of 4 donors and exhibited a minimal median log2 fold change (FC) of 0.5 in a single comparison are shown. (B) Heat map displaying median log2 FC of cytokine/chemokine levels in supernatants of Mϕ1 and Mϕ2 of 4 different donors. In this experimental setup monocytes were exposed to TMP195 (300 nM), TMP269 (300 nM), TSA (30 nM), or DMSO at equal v/v during differentiation toward Mϕ1 and Mϕ2. Gray color depicts cytokine/chemokine levels that were detected above the linear range of the assay. (C) Experimental setup as in (A). Variable Importance in Projection (VIP) scores of the first x-variate were extracted from each PLS-DA analysis and cytokine values ≥1 were considered relevant. In parallel, Kendall's tau-b correlation coefficients were calculated for each cytokine. Coefficients between 0–0.33, 0.33–0.67, and 0.67–1 were considered to have a weak, moderate and strong correlation, respectively. Every dot represents a cytokine/chemokine. Cytokines/chemokines with a VIP score >1 and demonstrating at least a moderate correlation are annotated in black. Annotated cytokines that were produced below or equal to a median concentration of 40 pg/ml are depicted by a diamond. (D) Experimental setup as in (B). VIP scores and Kendall's tau-b correlation coefficients calculations as in (C).
|
