FIGURE

Fig 1

ID
ZDB-FIG-200128-1
Publication
Bhattarai et al., 2020 - Neuron-glia interaction through Serotonin-BDNF-NGFR axis enables regenerative neurogenesis in Alzheimer's model of adult zebrafish brain
Other Figures
All Figure Page
Back to All Figure Page
Fig 1

IL4 regulates tryptophan metabolism.

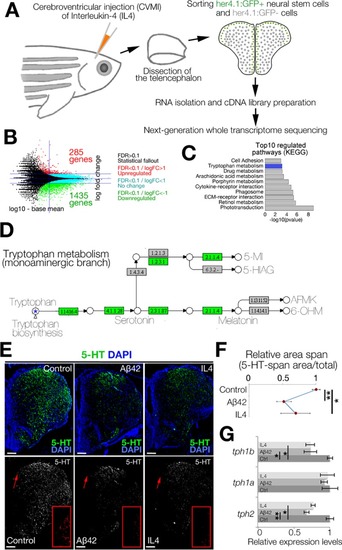
(A) Schematic view of the experimental pipeline for whole-transcriptome sequencing IL4 treatment. (B) MA-plot for DEGs. (C) GO-term analyses on DEGs. (D) Modified KEGG-pathway view of tryptophan metabolism. Green indicates the enzymes down-regulated by IL4. (E) IHC for 5-HT in control (left), Aβ42-injected (middle), and IL4-injected (right) brains. Single-channel images show 5-HT. Red insets are high-magnification images of arrowed regions. (Dm: dorsal-medial) (F) Quantification of 5-HT-span area density under the conditions of E. (G) qRT-PCR results for tph1a, tph1b, and tph2 in control, amyloid-injected, and IL4-injected zebrafish brains. Beta-actin used for normalization. n = 3 animals for experiments. Scale bars equal 100 μM. Data are represented as mean ± SEM. See also S1 Fig and S2 Fig. See S2 Data and S7 Data for supporting information. Aβ42, amyloid-beta42; DEG, differentially expressed gene; ECM, extracellular matrix; FC, fold change; FDR, false discovery rate; GFP, green fluorescent protein; GO, gene ontology; IHC, immunohistochemistry; KEGG, Kyoto Encyclopedia of Genes and Genomes; IL4, interleukin-4; MA, Bland-Altman mean-average plot; qRT-PCR, quantitative real-time polymerase chain reaction; 5-HT, serotonin.

Expression Data

Expression Detail
Antibody Labeling
Phenotype Data

Phenotype Detail
Acknowledgments
This image is the copyrighted work of the attributed author or publisher, and ZFIN has permission only to display this image to its users. Additional permissions should be obtained from the applicable author or publisher of the image. Full text @ PLoS Biol.