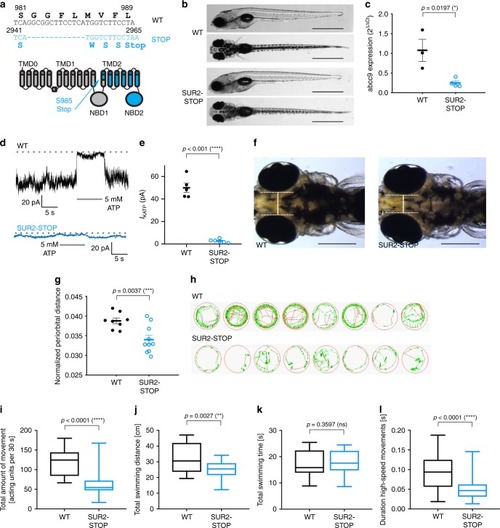
Hypotolerism and decreased locomotor behavior in SUR2-STOP zebrafish larvae. a The c.2944_2957del13 indel in abcc9 and consequent frameshift premature stop codon following S984 (p.S985Stop) and schematic of SUR2 with the site of the introduced S985Stop mutation in TM12 indicated, downstream region in blue. b Representative images illustrating the morphology of 5 dpf wild-type and SUR2-STOP mutants as seen from a left lateral (top) and dorsal view (bottom). Scale bars, 1 mm. c Quantitative RT-PCR to assess abcc9 expression in pools of 60 WT (three pools) and SUR2-STOP (four pools) embryos. d Representative current traces from inside–out patch clamp recordings from ventricular myocytes of WT (black; five patches) or SUR2-STOP (blue; six patches) zebrafish (−50 mV holding potential, ATP applied as indicated). e KATP channel currents from excised patches from zebrafish ventricular myocytes. The data from five patches (WT), and six patches (SUR2-STOP) from ≥ 3 zebrafish. f, g To assess hypotelorism, the distance between the convex tips of the eyes was measured and normalized to body length (WT, n = 8; HOM, n = 10). Scale bars, 200 μm. h Examples of movement traces shown in red, green, and black representing high-speed, intermediate, and slow movements, respectively. i–l Five-minute video recordings (n = 62 larvae per genotype) of 5 dpf homozygous SUR2-STOP fish and wild-type controls were analyzed for total amount of movement i, total swimming distance (TSD) j, total swimming duration k, and duration of high-speed movements l and compared with respective wild-type larvae. The data on the y-axis refer to the respective average value per 30-s (s) intervals. The data from four independent experiments (16 larvae per experiment) *p ≤ 0.05; **p ≤ 0.01; ***p ≤ 0.001; ****p ≤ 0.0001 (two-tailed unpaired Student’s t test or Mann–Whitney U test). The black horizontal bar indicates the mean value for each condition. Sample size, WT, n = 3; SUR2-STOP, n = 4 in c; WT, n = 5; SUR2-STOP, n = 5 in e; WT, n = 8; SUR2-STOP, n = 10 in g; WT, n = 62; SUR2-STOP, n = 62 in i–l. The data from individual experiments shown as dots alongside mean ± SEM. Source data are provided as a Source Data file
|
