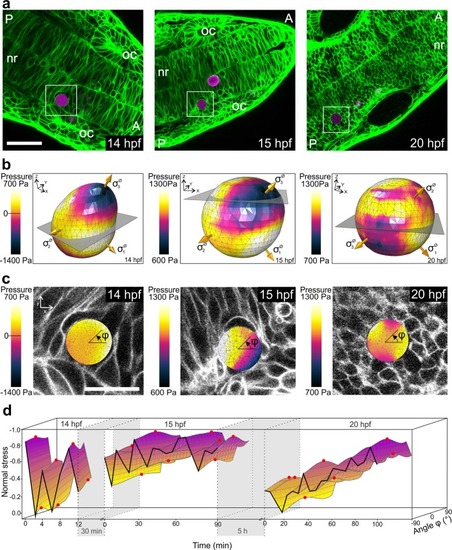
In vivo quantification of cellular stresses during zebrafish neural rod formation. (a) Confocal sections of the developing neural rod (nr) of a zebrafish embryo after bead injection at 14 hpf, 15 hpf, and 20 hpf. The PLL-Cy3 PAAm bead (magenta label; white box) is embedded between neural progenitor cells at the basal part of the neural rod, reframed by the developing otic placodes (oc). Anterior (A) and posterior (P) direction is always marked in the image. The plasma membrane of all cells in the zebrafish embryo is marked in green. Scale bar, 50 µm. (b) Representative contour plot of pressure distributed on the surface of the PAAm bead at the beginning of the imaging period at 14 hpf, 15 hpf, and 20 hpf. The golden arrows indicate the directions of the principal stresses. The grey slices represent the positions of the confocal planes depicted in (c). (c) Overlay of the cross-section of the contour plot (presented in b) and the corresponding confocal plane of the z-stack at 14 hpf, 15 hpf, and 20 hpf. The angle φ represents the orientation of the normal stress depicted in (d). Scale bar, 20 µm. (d) 3D representation of the distribution of normal stresses for the entire imaging period at 14 hpf, 15 hpf, and 20 hpf. Note that here amplified values which were normalized by absolute maximum values are depicted (see descriptions in the text). Maximum amplitudes of normal stresses are displayed as red dots. In this and all subsequent figures, the time periods between the measurements are indicated by grey areas. Sampling interval: 2 min at 14 hpf, 5 min at 15 and 20 hpf.
|
