FIGURE SUMMARY
Title

Polyacrylamide Bead Sensors for in vivo Quantification of Cell-Scale Stress in Zebrafish Development

Authors
Träber, N., Uhlmann, K., Girardo, S., Kesavan, G., Wagner, K., Friedrichs, J., Goswami, R., Bai, K., Brand, M., Werner, C., Balzani, D., Guck, J.
Source
Full text @ Sci. Rep.

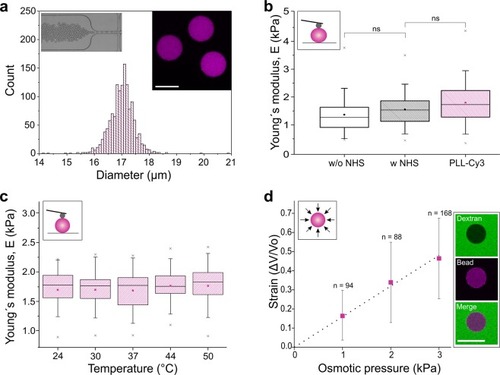
Mechanical characterization of polyacrylamide (PAAm) beads. (a) Size distribution of Cy3 conjugated Poly-L-lysine (PLL-Cy3) functionalized PAAm beads (n = 1339) determined by a macro implemented on Fiji28. Inset left: microscopic image of the bead production by microfluidic flow-focusing. Inset right: confocal microscopy section showing PAAm beads (magenta) functionalized with PLL-Cy3. Scale bar, 15 µm. (b) Young’s modulus of PAAm beads as determined by AFM-based indentation after PAAm polymerization (w/o NHS), after NHS ester modification (w NHS) and after PLL-Cy3 functionalization (n = 50, temperature = 24 °C). (c) Young’s modulus stability with increasing temperature. Identical PLL-Cy3 functionalized PAAm beads (n = 25) were measured for each condition. (d) Stress-strain relation of PLL-Cy3 functionalized PAAm beads during osmotic compression. The dotted line indicates a linear fit that is used for the determination of the bulk modulus. Results are represented as mean ± SD. Inset: confocal microscopy images of a PAAm bead (magenta) in dextran solution (FITC label, green) confirming that dextran molecules (hydrodynamic radius: 27 nm) are not able to enter the polymer network (mesh size: 21 nm28). Scale bar, 20 µm. (b,c) The boxes are determined by the 25th and 75th percentiles. The mean is shown as filled square symbol, the median as straight line, the whiskers represent the standard deviation and the 1st and 99th percentiles are indicated by crosses. (b–d) Insets are a schematic representation of the applied methods. A homogeneous osmotic pressure compressing the bead and a spherical cantilever tip indenting the PAAm bead, respectively.

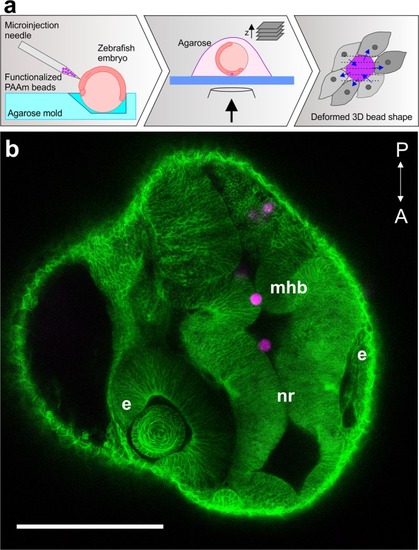
PAAm bead microinjection into zebrafish embryos. (a) Schematic illustration of the microinjection and imaging procedures. The embryo was immobilized in an agarose mold to facilitate upward orientation of the animal pole for microinjection. PLL-Cy3 PAAm beads were injected at the bud stage of zebrafish development (10 hpf). For confocal imaging of cell-force-induced bead deformations, the embryo was embedded in 1% low melting agarose. (b) PAAm bead trapped between the left and right side of a uniformly opened neural rod (nr) in the region of the midbrain-hindbrain boundary (mhb) of a zebrafish embryo at prim-15 stage (30 hpf). Developing eyes (e) and structures of the central nervous system are recognizable. Anterior (A) - posterior (P) direction is marked in the image. Scale bar, 200 µm; the PLL-Cy3 PAAm beads are magenta colored and the cell membranes are GFP-labeled (green).

In vivo quantification of cellular stresses during zebrafish neural rod formation. (a) Confocal sections of the developing neural rod (nr) of a zebrafish embryo after bead injection at 14 hpf, 15 hpf, and 20 hpf. The PLL-Cy3 PAAm bead (magenta label; white box) is embedded between neural progenitor cells at the basal part of the neural rod, reframed by the developing otic placodes (oc). Anterior (A) and posterior (P) direction is always marked in the image. The plasma membrane of all cells in the zebrafish embryo is marked in green. Scale bar, 50 µm. (b) Representative contour plot of pressure distributed on the surface of the PAAm bead at the beginning of the imaging period at 14 hpf, 15 hpf, and 20 hpf. The golden arrows indicate the directions of the principal stresses. The grey slices represent the positions of the confocal planes depicted in (c). (c) Overlay of the cross-section of the contour plot (presented in b) and the corresponding confocal plane of the z-stack at 14 hpf, 15 hpf, and 20 hpf. The angle φ represents the orientation of the normal stress depicted in (d). Scale bar, 20 µm. (d) 3D representation of the distribution of normal stresses for the entire imaging period at 14 hpf, 15 hpf, and 20 hpf. Note that here amplified values which were normalized by absolute maximum values are depicted (see descriptions in the text). Maximum amplitudes of normal stresses are displayed as red dots. In this and all subsequent figures, the time periods between the measurements are indicated by grey areas. Sampling interval: 2 min at 14 hpf, 5 min at 15 and 20 hpf.

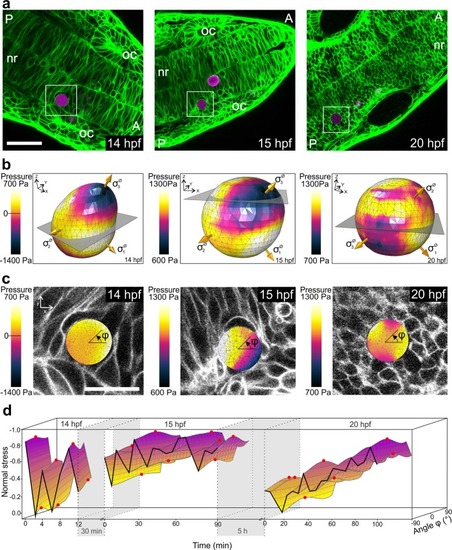
Spatial and temporal normal stress variations within the zebrafish neural rod during development. (a) Left panel: Confocal section of a PLL-Cy3 PAAm bead (white box) within the neural rod embedded between cells of the otic placode (oc) at the 10-somite stage (14 hpf) and the 12-somite stage (15 hpf). Right panel: 3D representation of the normal stress distribution for the entire imaging period at 14 hpf and 15 hpf, respectively. Sampling interval: 2 min at 14 hpf, 5 min at 15 hpf. (b) Left panel: Confocal section of a PLL-Cy3 PAAm bead (white box) embedded (in the same embryo as shown in panel a) close to the midline (ml) of the neural rod (nr) at the 10-somite stage and the 12-somite stage. Right panel: 3D representation of the normal stress distribution over the entire imaging period at 14 hpf and 15 hpf, respectively. Sampling interval: 2 min at 14 hpf, 5 min at 15 hpf. Note that positive normal stress values correspond with tensile stresses. (c) Left panel: Confocal section of a PLL-Cy3 PAAm bead (white box) close to the midline (ml) of the neural rod at 14 hpf. Inset: Identical bead after movement towards the basal part of the neural rod at the end of the imaging period at 14.5 hpf. Right panel: 3D representation of the normal stress distribution for the entire imaging period. Sampling interval: 3 min. (d) Left panel: Confocal section of a PLL-Cy3 PAAm bead trapped in the developing midbrain-hindrain (mbh) of the neural rod at 19 hpf. The dashed lines indicate the border of the mbh. Right panel: 3D representation of the normal stress distribution for the entire imaging period. Sampling interval: 2 min. (ad) Confocal images: anterior (A) and posterior (P) direction is always marked in the image. PLL-Cy3 PAAm bead (magenta label) and cell membranes (GFP labeled; green). Scale bar, 30 µm. Note that in the images to the right amplified values which were normalized by absolute maximum values are depicted (see descriptions in the text).

Acknowledgments
This image is the copyrighted work of the attributed author or publisher, and ZFIN has permission only to display this image to its users. Additional permissions should be obtained from the applicable author or publisher of the image. Full text @ Sci. Rep.