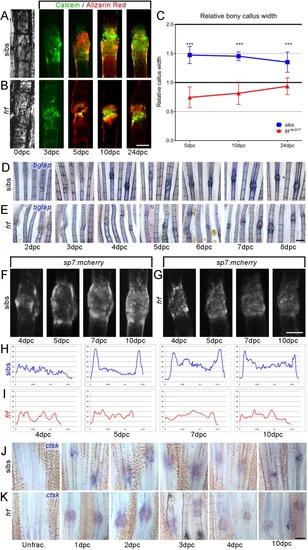
Abnormal bone callus architecture in zebrafish OI fractures. (A,B) Brightfield and fluorescent images of induced fractures in WT siblings (A) and frf (B) (at the dpc indicated) that underwent unification. Bone was alternately stained with calcein (green) or Alizarin Red (red) to visualise callus growth. (C) Bone callus formation in frf was delayed in comparison with WT, with relative callus width much lower at all stages measured (n=16 per time point). (D-G) Labelling of osteoblasts in induced fractures of frf (E,G) and siblings (D,F) at the indicated dpc, using in situ hybridisation for bglap (osteocalcin) (D,E) and confocal imaging of sp7:mcherry (F,G). No overt change in osteoblast recruitment was observed. (H,I) Intensity plots of mCherry fluorescence across the callus of sample images of WT (H) and frf (I) fractures, as measured from F,G. Osteoblasts did not form a marked collar around the callus and were more homogeneous across the callus in frf. (J,K) ctsk in situ labelling of osteoclasts in frf (K) and sibling (J) fin rays unfractured or following crush. Osteoclasts were present in both siblings and mutants following crush injury. ***P<0.001; ANOVA with Tukey post test. Scale bars: in B and G, 100 µm for A,B,F,G; in E and K, 200 µm for D,E,J,K.
|
