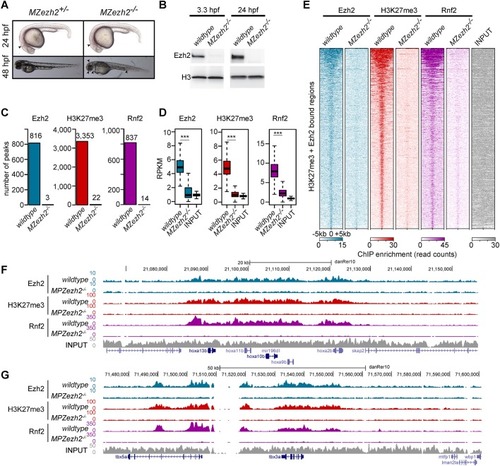
MZezh2 mutant (MZezh2−/−) embryos lack Ezh2, H3K27me3 and Rnf2 binding to the chromatin. (A) MZezh2+/− (developing as wild-type embryos) and MZezh2−/− embryos at 24 and 48 hpf. At 24 hpf, MZezh2−/− embryos lack a clear mid-hindbrain boundary compared with heterozygous embryos (arrowhead). At 48 hpf, MZezh2−/− embryos showed pleiotropic phenotypes compared with heterozygous embryos, such as small eyes, small brain, heart edema and blood accumulation in the blood island (arrowheads). (B) Western blot analysis of Ezh2 at 3.3 hpf and 24 hpf of wild-type and MZezh2−/− embryos. Histone H3 was used as a loading control. Results presented are representative of three biological replicates. (C) Number of peaks called after Ezh2, H3K27me3 and Rnf2 ChIP-seq of wild-type and MZezh2−/− embryos at 24 hpf. Each peak set was obtained by the intersection of two independent biological replicates. (D) Box plots of Ezh2, H3K27me3 and Rnf2 RPKM-normalized coverage after respective ChIP-seq in wild-type and in MZezh2−/− embryos at 24 hpf. The input control was obtained from wild-type embryos at 24 hpf. Coverages were calculated based on peaks detected in wild-type embryos. ***P<0.001 (t-test). The box represents the first quartile, median and third quartile. The whiskers below and above the box represent the minimum and maximum values. (E) Heatmaps for Ezh2, H3K27me3 and Rnf2 subsampled counts after ChIP-seq in 24 hpf wild-type and MZezh2−/− embryos. Heatmaps are ordered based on coverage intensity in Ezh2 and H3K23me3 ChIP-seq performed in wild types. Windows of 10 kb regions for all H3K27me3 or Ezh2 peaks in 24 hpf wild-type embryos are shown. The input track obtained from 24 hpf wild-type embryos was used as control and was not subsampled. (F,G) UCSC genome browser snapshot depicting the loss of Ezh2, H3K27me3 and Rnf2 after ChIP-seq in 24 hpf MZezh2−/− embryos compared with wild-type embryos for (F) the hoxab gene cluster and (G) the tbx5a gene. Colors represent ChIP-seq for different proteins: blue, Ezh2; red, H3K27me3; purple, Rnf2; gray, input control.
|
