|
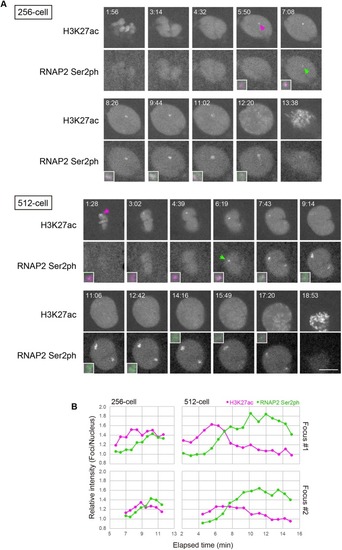
Dynamics of histone H3K27ac and transcription foci at the 256- and 512-cell stages. (A) Simultaneous visualization of RNAP2 Ser2ph and H3K27ac at the 256- and 512-cell stages. Embryos were injected with Fabs specific for RNAP2 Ser2ph (Alexa 488), H3K27ac (Cy3) and H3K9ac (Cy5). Single confocal sections for RNAP2 Ser2ph and H3K27ac are shown. RNAP2 Ser2ph accumulated close to H3K27ac foci. Arrows indicate H3K27ac and RNAP Ser2ph foci in the nucleus. Magnified and merged images of foci are shown in insets (H3K27ac, magenta; RNAP2 Ser2ph, green). Elapsed time (min:s) is indicated. See also Movies 6 and 7 for the 256- and 512-cell stages, respectively. Scale bar: 10 μm. (B) Relative intensity of foci. The intensity of H3K27ac and RNAP2 Ser2ph foci was measured and normalized to that of the whole nucleus to yield the foci/nucleus ratio.
|