
Fig. 3.
- ID
- ZDB-IMAGE-191230-425
- Publication
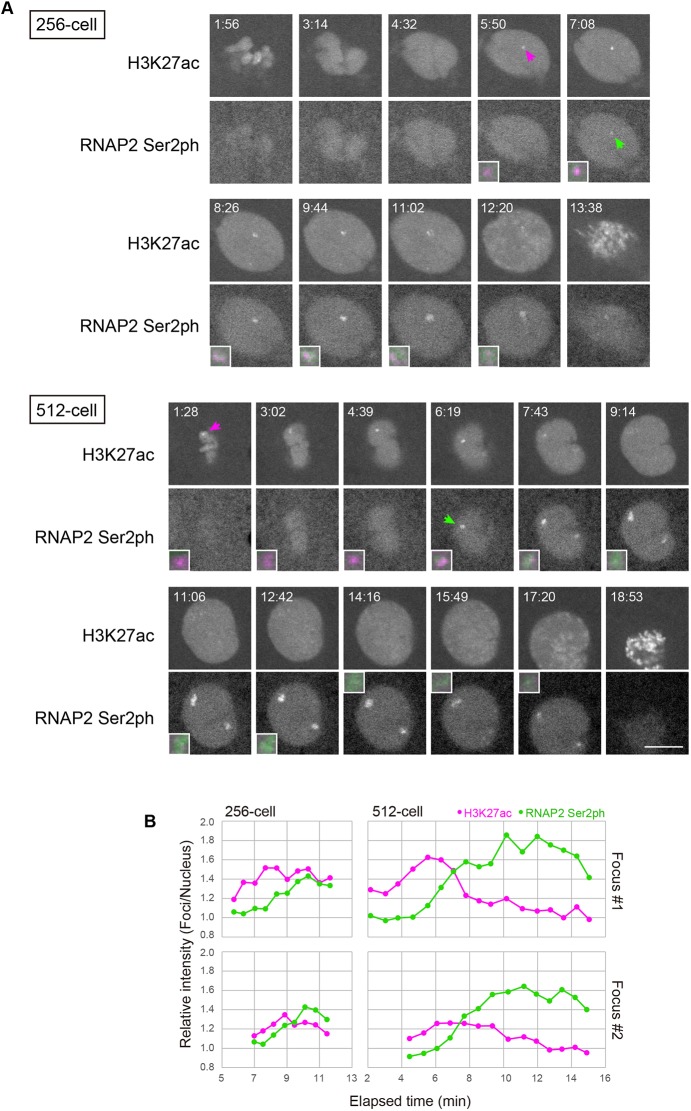
- Sato et al., 2019 - Histone H3K27 acetylation precedes active transcription during zebrafish zygotic genome activation as revealed by live-cell analysis
- All Figures
- Figures for Sato et al., 2019
|
Fig. 3.