
Figure 1-figure supplement 1.
- ID
- ZDB-FIG-191230-1823
- Publication
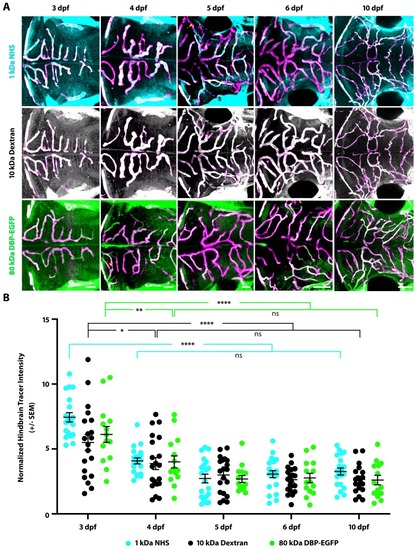
- O'Brown et al., 2019 - Suppression of transcytosis regulates zebrafish blood-brain barrier function
- Other Figures
- All Figure Page
- Back to All Figure Page
( |