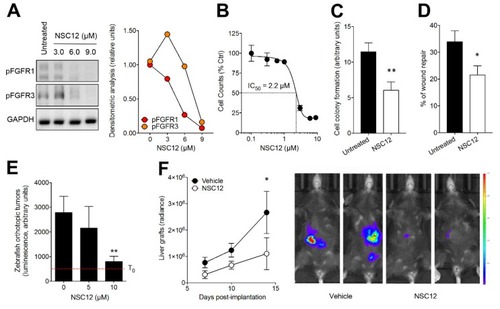
Effect of the pan FGF-trap NSC12 on B16-LS9 cells. (A) Western blot analysis of FGFR1 and FGFR3 phosphorylation in B16-LS9 cells treated for 12 h with increasing concentrations of NSC12. The right panel shows the densitometric analysis of immunoreactive bands normalized to GAPDH protein levels. (B) Effect of NSC12 treatment on the proliferation of B16-LS9 cells. Viable cells were counted after 24 h of incubation with increasing concentrations of NSC12. Data are the mean ± SEM (n = 3). (C) B16-LS9 cells were seeded at 50 cells/cm2 and treated with 2.5 µM NSC12. After 10 days, cell colonies were stained with crystal violet and quantified by computerized image analysis. Data are the mean ± SEM of 15 fields for each triplicate sample. (D) A mechanical wound was performed in a B16-LS9 cell monolayer followed by incubation with 3.0 µM NSC12. After 18 h, cell migration at the leading edge of the wound was quantified by computerized image analysis. Data are the mean ± SEM of six microscopic fields. (E) B16-LS9-luc cells were injected into the eye of 48 hpf zebrafish embryos (100 cells/embryo). Then, embryos were incubated with increasing concentrations of NSC12 at T0. Tumor growth was evaluated 3 days after grafting by measuring the cell luminescence signal. Data are the mean ± SEM (n = 20). (F) B16-LS9-luc cells were grafted in the liver of syngeneic mice (50,000 cells/graft). Next, vehicle or NSC12 (7.5 mg/kg) were injected i.p. every other day and tumor growth was imaged with IVIS Lumina III for the following 14 days. Data are the mean ± SEM (n = 9). Representative images of control and NSC-12 treated mice imaged 14 days after grafting are shown on the right. *p < 0.05; **p < 0.01, Student’s t-test (C,D), one-way (E) and two-way (F) analysis of variance.
|
