
FIGURE
Figure 2
- ID
- ZDB-FIG-191230-1584
- Publication
- Rezzola et al., 2019 - The Autocrine FGF/FGFR System in both Skin and Uveal Melanoma: FGF Trapping as a Possible Therapeutic Approach
- Other Figures
- All Figure Page
- Back to All Figure Page
Figure 2
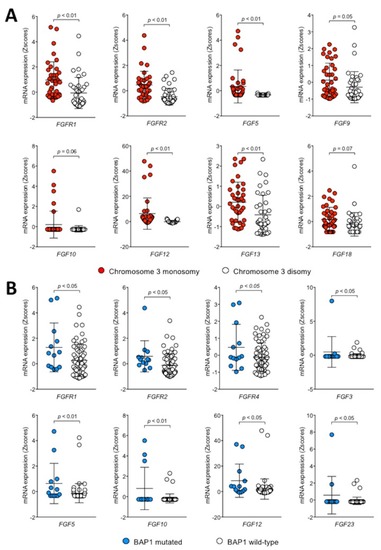
Correlation between FGF/FGFR expression and chromosome 3 / |
Expression Data
Expression Detail
Antibody Labeling
Phenotype Data
Phenotype Detail
Acknowledgments
This image is the copyrighted work of the attributed author or publisher, and
ZFIN has permission only to display this image to its users.
Additional permissions should be obtained from the applicable author or publisher of the image.
Full text @ Cancers