
Figure 5
- ID
- ZDB-FIG-191230-1460
- Publication
- Pedroni et al., 2019 - Large-Scale Analysis of the Diversity and Complexity of the Adult Spinal Cord Neurotransmitter Typology
- Other Figures
- All Figure Page
- Back to All Figure Page
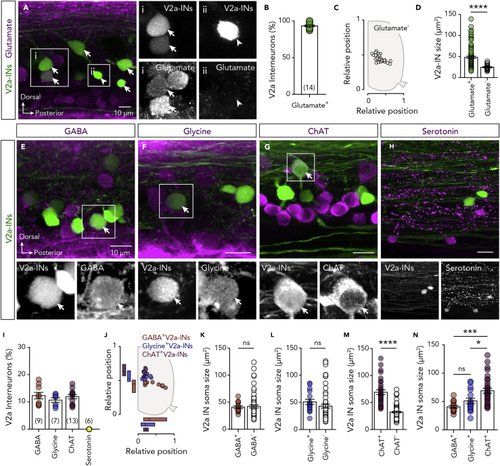
V2a Interneuron Neurotransmitter Diversity (A and B) Representative whole-mount photomicrographs and analysis showing that the vast majority, but not all, of the adult zebrafish spinal cord V2a interneurons are expressing glutamate. Arrows indicate the double-labeled neurons. Arrowheads indicate the non-glutamatergic V2a interneurons. (C) Setting positions of the glutamate− (open circles) V2a interneurons in the spinal cord. (D) Plot showing the difference in soma sizes of the glutamate+ (green circles) and glutamate− (open circles) V2a interneurons. (E-H) Whole-mount double immunolabeling between V2a interneurons with GABA, glycine, ChAT, or serotonin. In black and white are single channel images of the merged images. Arrows indicate the double-labeled neurons. (I and J) Analysis of the percentage and the topographic organization of the V2a interneurons that express GABA, glycine, or ChAT. (K–M) Quantification of the V2a interneuron soma sizes that are immune-positive and immune-negative for the GABA, glycine, or ChAT (unpaired t test: t = 10.65, df = 111, P < 0.0001). (N) Comparison of the V2a interneuron soma sizes that express GABA, glycine, or ChAT (one-way ANOVA: F(2,58) = 10.44, P = 0.0001). Data are presented as mean ± SEM. *P < 0.05; ***P < 0.001; ****P < 0.0001; ns, non-significant. For related data and antibodies information, see also |