
- Title
-
Large-Scale Analysis of the Diversity and Complexity of the Adult Spinal Cord Neurotransmitter Typology
- Authors
- Pedroni, A., Ampatzis, K.
- Source
- Full text @ iScience
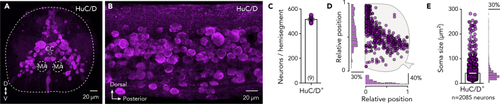
Neuroanatomy of Adult Zebrafish Spinal Cord (A and B) Transverse section and whole-mount adult zebrafish spinal cord showing the expression of the pan-neuronal marker HuC/D+ neurons. (C) Quantification of the number of spinal neurons (HuC/D+) located in adult spinal cord hemisegment (segment 15). (D) Spatial distribution of the HuC/D+ neurons with the medio-lateral and dorsoventral density plot from one adult zebrafish spinal hemisegment ( (E) Quantification and distribution of the HuC/D+ neurons soma size ( Data are presented as mean ± SEM. CC, central canal; MA, Mauthner axon. For antibodies information, see also |
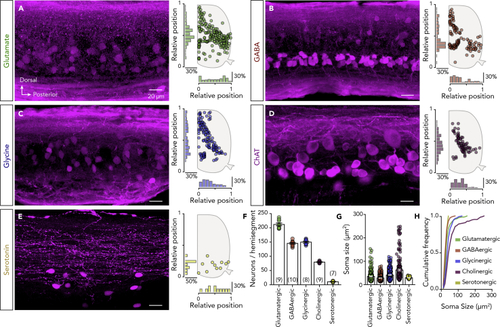
Neurotransmitter Phenotypes of the Adult Zebrafish Spinal Neurons (A–E) Representative whole-mount photomicrographs showing part of the immunolabeled cells for glutamate, GABA, glycine, ChAT, and serotonin, followed by a schematic representation of the spatial distribution with the corresponding medio-lateral and dorsoventral density plots from a single adult zebrafish spinal cord hemisegment. (F) Quantification of the total number of the labeled neurons expressing a specific neurotransmitter phenotype. (G and H) Quantification and cumulative frequency of labeled neurons soma size. Data are presented as mean ± SEM. For related data and antibodies information, see also EXPRESSION / LABELING:
|
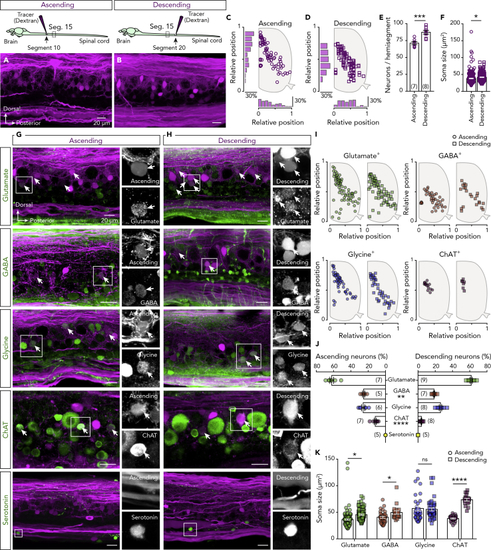
Neurotransmitter Phenotype of Projecting Neurons (A and B) Injection of a dextran tracer in segment 10 or 20 reveals the ascending and descending spinal projecting neurons, respectively, located in spinal cord segment 15. (C and D) Setting positions of the tracer-labeled ascending (circles) and descending (squares) neurons that project to the rostral or caudal part of the spinal cord revealed in one representative preparation. (E) Quantification of the total number of ascending and descending neurons detected in the spinal cord hemisegment. (F) Plot showing the soma sizes of the tracer-labeled ascending and descending neurons (Ascending: (G and H) Double staining between ascending or descending traced neurons (magenta) with glutamate, GABA, glycine, ChAT, and serotonin (green). Arrows indicate the double-labeled neurons. On the right side, there are single channel magnifications of the boxed area. (I) Spatial distribution of the ascending (circles) and descending (squares) traced neurons that express a specific neurotransmitter phenotype. (J) Quantification of percentage of tracer-positive ascending and descending projecting neurons expressing each neurotransmitter phenotype. (K) Soma sizes of the tracer-positive ascending (circles) and descending (squares) projecting neurons. Data are presented as mean ± SEM; *P < 0.05; **P < 0.01; ***P < 0.001; ****P < 0.0001; ns, non-significant. For antibodies information, see also EXPRESSION / LABELING:
|
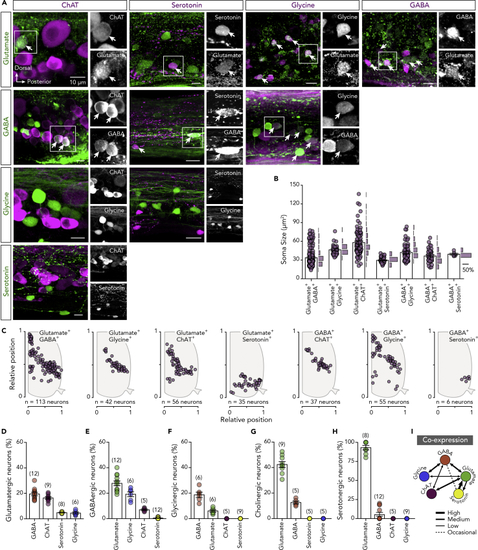
Spinal Cord Neurons Express Multiple Neurotransmitter Phenotypes (A) Whole-mount double immunolabeling between glutamate, GABA, glycine, ChAT, and serotonin. In black and white are single channel images of the merged images. Arrows indicate the double-labeled neurons. (B and C) Soma sizes and spatial distribution of the detected double-stained neurons in the adult zebrafish spinal cord hemisegment. (D–H) Quantification of percentage of glutamatergic, GABAergic, glycinergic, cholinergic (ChAT+), and serotonergic neurons that co-express other neurotransmitters. (I) Schematic relationship of the neurotransmitters co-expression from the adult zebrafish spinal cord neurons. Data are presented as mean ± SEM. For related data and antibodies information, see also |
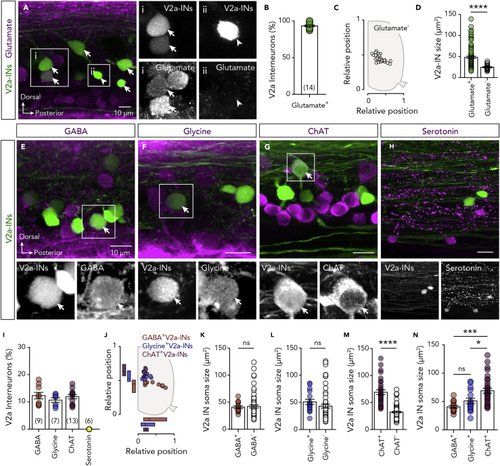
V2a Interneuron Neurotransmitter Diversity (A and B) Representative whole-mount photomicrographs and analysis showing that the vast majority, but not all, of the adult zebrafish spinal cord V2a interneurons are expressing glutamate. Arrows indicate the double-labeled neurons. Arrowheads indicate the non-glutamatergic V2a interneurons. (C) Setting positions of the glutamate− (open circles) V2a interneurons in the spinal cord. (D) Plot showing the difference in soma sizes of the glutamate+ (green circles) and glutamate− (open circles) V2a interneurons. (E-H) Whole-mount double immunolabeling between V2a interneurons with GABA, glycine, ChAT, or serotonin. In black and white are single channel images of the merged images. Arrows indicate the double-labeled neurons. (I and J) Analysis of the percentage and the topographic organization of the V2a interneurons that express GABA, glycine, or ChAT. (K–M) Quantification of the V2a interneuron soma sizes that are immune-positive and immune-negative for the GABA, glycine, or ChAT (unpaired t test: t = 10.65, df = 111, P < 0.0001). (N) Comparison of the V2a interneuron soma sizes that express GABA, glycine, or ChAT (one-way ANOVA: F(2,58) = 10.44, P = 0.0001). Data are presented as mean ± SEM. *P < 0.05; ***P < 0.001; ****P < 0.0001; ns, non-significant. For related data and antibodies information, see also |