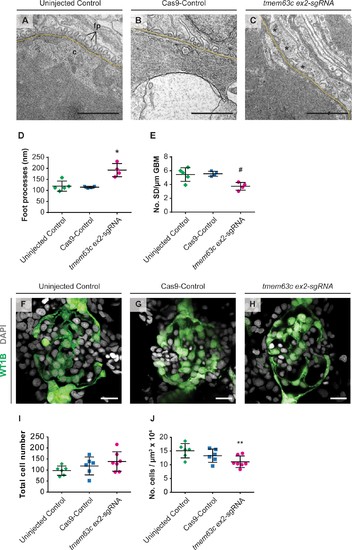
( A–E) Electron microscopy and quantitative assessment of GFB ultrastructure. Representative electron microscopy pictures of the GFB in uninjected Controls ( A), Cas9-Controls ( B) and after tmem63c knockdown ( C), asterisks indicate effaced podocyte foot processes). Quantitative analysis of podocyte foot process width ( D) and number of slit diaphragms per µm GBM ( E). Uninjected Control ( n = 5); Cas9-Control ( n = 4); tmem63c ex2-sgRNA ( n = 4); Scale bar = 1 µm; values plottet: mean ±SD; One-way ANOVA with Bonferroni’s multiple comparisons test; *p=0.0019 vs. uninjected Control, *p=0.0017 vs Cas9-Control; # p=0.0171 vs. uninjected Control , # p=0.0148 vs. Cas9-Control. ( F–J) Confocal microscopy and analysis of absolute and relative podocyte cell number in Tg(wt1b:EGFP) at 96 hpf. Representative confocal microscopy pictures of glomeruli in uninjected Controls ( F), Cas9-Controls ( G) and after tmem63c knockdown ( H). Quantitative analysis of absolute ( I) and relative ( J) podocyte cell number. Relative podocyte cell number has been obtained after normalization to the glomerular volume. Uninjected Control ( n = 6); Cas9-Control ( n = 6); tmem63c ex2-sgRNA ( n = 7); Scale bar = 15 µm; values plottet: mean ±SD; One-way ANOVA with Bonferroni’s multiple comparisons test; **p=0.0421 vs. uninjected Control.