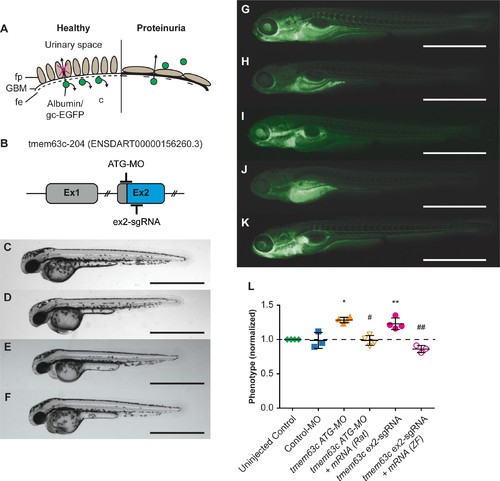
(A) Scheme of the GFB in healthy and albuminuric zebrafish embryos. Green fluorescent protein (gc-EGFP) represents an albumin surrogate and is filtrated after impairment of the GFB. fe, fenestrated endothelium; fp, foot processes of podocytes; GBM, glomerular basement membrane. (B) Schematic of tmem63c showing the target regions in Exon 2 (ex2) used for Morpholino (MO)- and CRISPR/Cas9-mediated somatic mutagenesis. (C–F) Bright field view of wildtype embryos at 48 hr post-fertilization (hpf) in uninjected controls (C), ATG-MO injected (D), 159.6 ng/µl ex2-sgRNA injected (E), and 250 ng/µl ex2-sgRNA injected embryos (F). Scale bar = 1 mm. (G–K) Fluorescence microscopy of Tg[fabp10a:gc-EGFP] embryos at 120 hpf. Uninjected control with clearly visible gc-EGFP fluorescence in the trunk vasculature (‘fluorescent’) (G). tmem63c ATG-MO-injected embryo with partial or a complete loss of trunk fluorescence (‘deficient-fluorescent’) (H) and tmem63c ATG-MO +Tmem63c mRNA (Rat) co-injected embryo (I) showing rescue of the phenotype. Tmem63c ex2-sgRNA-injected embryo with partial or a complete loss of trunk fluorescence (‘deficient-fluorescent’) (J) and tmem63c ex2-sgRNA + tmem63c mRNA (ZF) co-injected embryo (K) showing rescue of the phenotype. Scale bar = 1 mm. (L) Analysis of gc-EGFP in the trunk vasculature. Shown are embryos categorized as ‘deficient-fluorescent’ (df), see Materials and method section and Figure 7—figure supplement 2 for details. Experimental groups are normalized to the corresponding uninjected control group per experiment. Uninjected Control (n = 1198); Control-MO (n = 189); tmem63c ATG-MO (n = 227); tmem63c ATG-MO +Tmem63c mRNA (Rat) (n = 230); tmem63c ex2-sgRNA (n = 371); tmem63c ex2-sgRNA + tmem63c mRNA (ZF) (n = 126); One-way ANOVA with Bonferroni’s multiple comparisons test. Values plottet: mean ±SD, dashed line at y = 1 indicates the uninjected control level; *p=0.0002 vs. uninjected Control, #p<0.0001 vs. tmem63c ATG-MO. **p=0.0014 vs. uninjected Control, ##p<0.0001 vs. tmem63c ex2-sgRNA. Data points in the graph represent the ratio per independent experiment, %(Uninjected Control (df)) / %(experimental group (df)), N ≥ 3. (See Figure 7—figure supplement 1 and Figure 7—figure supplement 2).