
Fig. S6
- ID
- ZDB-FIG-190925-31
- Publication
- Kramer et al., 2019 - Neuronal Architecture of a Visual Center that Processes Optic Flow
- Other Figures
- All Figure Page
- Back to All Figure Page
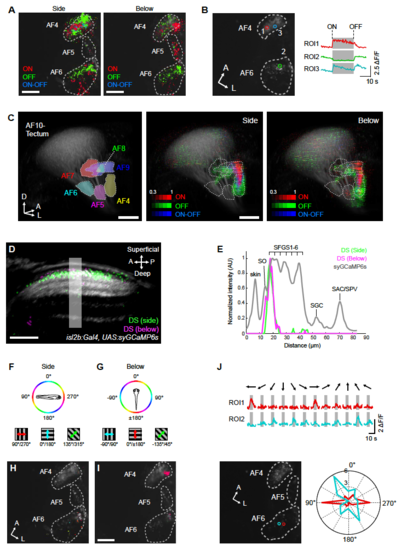
Mapping of orientation-selectivity, directionselectivity, and luminance responses in RGC terminals. (A) Response profile to luminance changes in AF 4, 5, and 6 presented from the side or below. Pixels are color coded according to the mutually exclusive luminance response types: pixels responsive to increase in luminance (ON), decrease in luminance, and both increase and decrease in luminance (ON-OFF). (B) Representative luminance response in AF4 and 6. Visual stimuli were presented from the side. ROIs correspond to synaptic puncta marked in the right panel. Note that AF5 is not contained in this optical plane. In (A) and (B), functional pixels are plotted on top of the mean image of syGCaMP6s (gray). (C) 3D representation of luminance response in RGC terminals. (Left) 3D model of AFs (as Figure 2B). For side presented 3D map, both AF10 and AF 4, 5, and 6 volumes are pooled from 6 functionally imaged volumes. For underneath presented 3D map, both AF10 and AF 4, 5, and 6 volumes are pooled from 7 functionally imaged volumes. The intensity of pixels corresponds to the frequency of a particular pixel to be luminance responsive across all imaged fish. Note that AF4 and AF9 contain highly luminance responsive RGC terminals and AF5 is weakly ON responsive (right panel). (D) Localization of DS pixels in tectal sublaminae. After registration into the RGC reference brain, DS pixels identified by the side (green) and below (magenta) presentations of visual stimuli were overlaid to the average image of isl2b:Gal4, UAS:syGCaMP6s signals of the same registered volume. DS pixels tuned to forward motion are plotted here for both side and below stimulus presentations. The volume was sliced obliquely to reveal laminar structure along the superficial-deep axis within the tectal neuropil. (E) Intensity plot along region indicated by a box shown in (D). Note that DS pixels for both stimulus positions (side, below) occupy SFGS1. (F, G) Color scheme of orientation space for motion presented from the side (F) and below (G). (H, I) Orientation selectivity (OS) in AF4, AF5 and AF6. The motion was presented from the side (H) and below (I). The color code is shown in (F, G). OS pixels are plotted on top of the mean image of syGCaMP6s (gray). (J) Representative responses of OS-RGC terminals in AF6. Visual stimuli were presented from the side. ROIs correspond to synaptic puncta marked by the two circular ROIs in the bottom left image. Polar plot (bottom right) is derived from the ΔF/F traces shown above. A, anterior; P, posterior; D, dorsal, L, lateral. SO, stratum opticum; SFGS, stratum fibrosum et griseum superficiale; SGC, stratum griseum centrale; SAC, stratum album centrale. Scale bars: 10 μm (A, I), 30 μm (D) and 50 μm (C). |