
Fig. 2
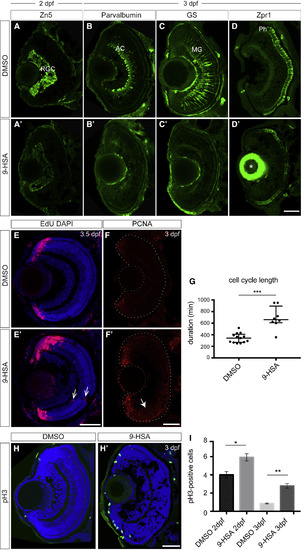
9-HSA Exogenous Administration Leads to Defects in Retinal Progenitor Cell Differentiation and to an Increase in Proliferation in the Retina (A–D’) 9-HSA exogenous administration leads to defects in differentiation during retinal development for all cell types analyzed. (A)–(A’) Immunohistochemistry of anti-Zn5 (green) labeling retinal ganglion cells (RGCs) on 2 days post-fertilization (dpf) frontal retinal cryosections from DMSO-treated (A) and 9-HSA-treated (A’) embryos. No RGC labeling was observed in the central part of the retina at 2 dpf in 9-HSA treated in comparison to DMSO-treated control retinae. (B)–(B’) Immunohistochemistry of anti-Parvalbumin (green) labeling amacrine cells (AC) and displaced AC on 3 dpf frontal retinal cryosections from DMSO-treated (B) and 9-HSA-treated (B’) embryos. Similar to RGCs, no ACs or displaced ACs were observed in 9-HSA-treated in comparison to DMSO-treated control retinae. (C)–(C’) Immunohistochemistry of anti-GS (green) labeling Müller glia cells (MGs) on 3 dpf frontal retinal cryosections from DMSO-treated (C) and 9-HSA-treated (C’) embryos revealed no MG differentiation in 9-HSA-treated in comparison to the DMSO control retinae. (D)–(D’) Immunohistochemistry of anti-Zpr1 (green) labeling photoreceptor cells (Ph) on 3 dpf frontal retinal cryosections from DMSO-treated (D) and 9-HSA-treated (D’) embryos. No Zpr1 labeling was observed in the central part of 9-HSA-treated retinae compared to DMSO-treated control retinae, where Zpr1-positive Ph could be detected within the outer nuclear layer of the 3 dpf retinal tissue. Asterisk in (D’) indicates unspecific antibody trapping in the lens. (E–I) 9-HSA exogenous administration leads to an increase in proliferation in the retina. (E)–(E’) EdU incorporation assay at 2.5 days postfertilization (dpf) in DMSO-treated control and 9-HSA-treated embryos detected by immunohistochemistry after 24 h shows an increase in the number of cells that actively replicated their DNA (S phase, red) during these 24 h at 3.5 dpf in the ciliary marginal zone, which was expanded in the 9-HSA-treated retinae. Nuclear counterstaining was also performed on these retinal sections by DAPI labeling (blue). (F)–(F’) Immunohistochemistry of anti-PCNA (red) labeling cells in S phase of the cell cycle on 3 dpf frontal retinal cryosections. 9-HSA-treated retinae showed an expanded PCNA labeling in the ciliary marginal zone and in the central retina (white arrow) in comparison to DMSO-treated control retinae at 3 dpf. (G) Quantification of the cell-cycle duration between two S phases of PCNA-GFP-positive RPCs from 9-HSA- and DMSO-injected embryos from 32 to 48 hpf. Time was measured in min. A significant increase in the cell-cycle length of RPCs from 9-HSA-injected embryos was observed (345.5 ± 23.24 min for DMSO in n = 13 cells compared to 691.3 ± 68.06 min for 9-HSA in n = 8 cells, p value: 0.0003 depicted as ∗∗∗). Statistical significance was determined using a Mann-Whitney U test. (H–H’) Immunohistochemistry of anti-pH3 (green) labeling of cells in M phase of the cell cycle on 3 dpf frontal retinal cryosections counterstained with the nuclear marker DAPI (blue). 9-HSA-treated retinae showed a higher number of mitotic cells in comparison to DMSO-treated control retinae at 3 dpf. (I) Quantification of the mitotic index at 2 and 3 dpf shows a significant increase in the percentage of pH3-positive cells in 9-HSA-treated retinae with respect to DMSO-treated control retinae at 2 and 3 dpf (n = 5, p value: 0.0176 at 2 dpf and n = 4, p value: 0.0060 at 3 dpf). Statistical significance for this quantification was determined using Student’s t test and depicted as: ∗p value < 0.05; ∗∗ p value < 0.01. Scale bars, 50 μm. |
| Antibodies: | |
|---|---|
| Fish: | |
| Condition: | |
| Anatomical Terms: | |
| Stage Range: | Long-pec to Protruding-mouth |
| Fish: | |
|---|---|
| Condition: | |
| Observed In: | |
| Stage Range: | Prim-15 to Protruding-mouth |
Reprinted from Developmental Cell, 50(1), Albadri, S., Naso, F., Thauvin, M., Gauron, C., Parolin, C., Duroure, K., Vougny, J., Fiori, J., Boga, C., Vriz, S., Calonghi, N., Del Bene, F., Redox Signaling via Lipid Peroxidation Regulates Retinal Progenitor Cell Differentiation, 73-89.e6, Copyright (2019) with permission from Elsevier. Full text @ Dev. Cell