
Fig. S3
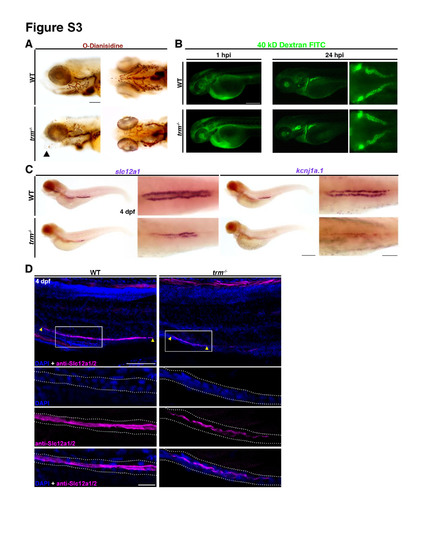
Additional phenotype analysis of trm-/- mutant embryos. A. O-dianisidine staining of craniofacial vasculature in WT and trm-/- at 4 dpf. Abnormal cartilage (black arrowhead). Scale bar = 100 μm. B. Kidney function assay was performed by injecting 40 kD Dextran FITC into the circulation of 2 dpf WT and trm-/- larvae. Images were collected 1-hour post injection and 24-hours post injection. Right panel: nephron tubules labeled with green fluorescence indicate endocytosis of Dextran. Scale bar = 150 μm. C. WISH DE markers (slc12a1 and kcnj1a.1) in WT and trm-/-. Scale bars = 200 μm, 50 μm. D. IF for Slc12a1/2 (magenta) in WT and trm-/-. Yellow arrowheads signal the start and end of Slc12a1 pronephric expression. White boxes indicate 60x mag (below). Scale bars = 100 μm, 10 μm. |