
Fig. 6
- ID
- ZDB-FIG-190918-6
- Publication
- Hendrick et al., 2019 - Bar, stripe and spot development in sand-dwelling cichlids from Lake Malawi
- Other Figures
- All Figure Page
- Back to All Figure Page
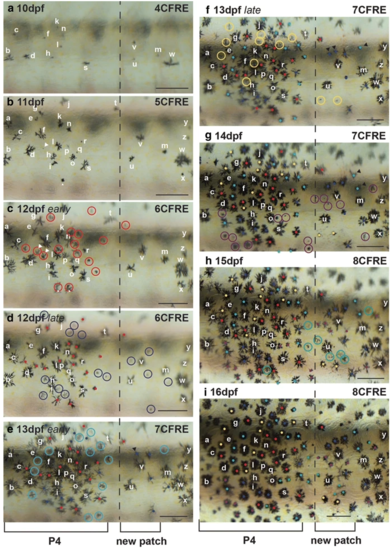
Timelapse recording of bar melanophore development in C. azureus. a–i Melanophores of presumptive lateral patch P4 (left) and a posteriorly appearing patch over 6 days of development. Melanophores present at 10dpf (a) and 11dpf (b) are identified by the same letters at all timepoints. c New melanophores are circled in red at this stage (12dpf early), and by red dots at subsequent stages. White arrowheads indicate daughter cells produced by melanophore mitosis. d New melanophores are circled in dark blue at this stage (12dpf late), and by dark blue dots at subsequent stages. e New melanophores are circled in light blue at this stage (13dpf early), and by light blue dots at subsequent stages. f New melanophores are circled in yellow at this stage (13dpf late), and by yellow dots at subsequent stages. Black arrowheads indicate daughter cells produced by melanophore mitosis. g New melanophores are circled in purple at this stage (14dpf), and by purple dots at subsequent stages. Black arrowheads indicate daughter cells produced by melanophore mitosis. h New melanophores are circled in green at this stage (15dpf), and by green dots at subsequent stages. i The relative positions of all melanophores examined remained largely unchanged from 10 to 16dpf. Scale = 250 µm |