
FIGURE
Fig. 1
- ID
- ZDB-FIG-190913-7
- Publication
- Zhang et al., 2019 - Transcriptomic profile of early zebrafish PGCs by single cell sequencing
- Other Figures
- All Figure Page
- Back to All Figure Page
Fig. 1
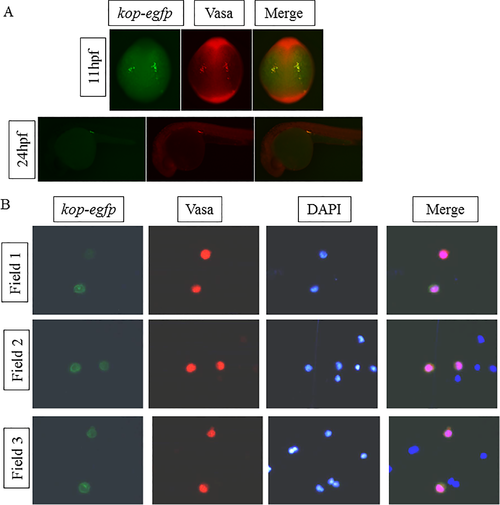
Confirmation of the zebrafish PGCs by immunostaining with Vasa antibody. (A) Whole mount immunostaining with Vasa antibody. Cells containing Vasa proteins can give out red fluorescence (second column). (B) Digested cells from zebrafish gonad at 24 hpf stained by Vasa antibody (second column) and DAPI (third column). Field 1, Field 2 and Field 3 mean three different fields of the glass slide under the microscope. |
Expression Data
| Gene: | |
|---|---|
| Antibody: | |
| Fish: | |
| Anatomical Term: | |
| Stage Range: | 1-4 somites to Prim-5 |
Expression Detail
Antibody Labeling
Phenotype Data
Phenotype Detail
Acknowledgments
This image is the copyrighted work of the attributed author or publisher, and
ZFIN has permission only to display this image to its users.
Additional permissions should be obtained from the applicable author or publisher of the image.
Full text @ PLoS One