
Fig. 3
- ID
- ZDB-FIG-190910-18
- Publication
- Brockway et al., 2019 - Multicolor lineage tracing using in vivo time-lapse imaging reveals coordinated death of clonally related cells in the developing vertebrate brain
- Other Figures
- All Figure Page
- Back to All Figure Page
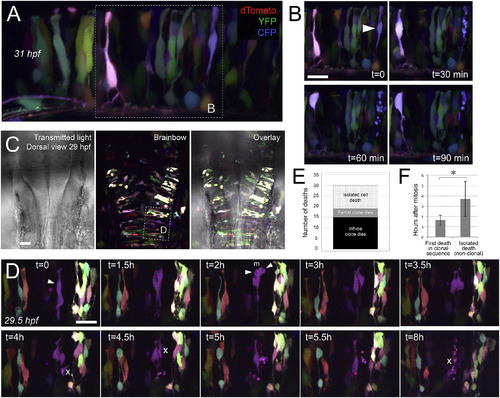
Cells within dividing clones in the ventricular zone undergo coordinated death in vivo. A) Zebrafish hindbrain at 31 hpf labeled with Brainbow (maximum intensity projection representing 36μm). White dashed box indicates inset shown in the first time point in B. B) Series of time points showing hindbrain in A at 30-min intervals. White arrowhead in first panel shows lavender cell that will undergo apoptosis in subsequent panels, indicated by cell fragmentation followed by gradual clearance of apoptotic bodies. Neighboring labeled cells appeared healthy throughout. Dorsal is up and rostral is to the left. C) Dorsal view of 29 hpf zebrafish hindbrain labeled with Brainbow; transmitted light channel shows the morphology of hindbrain and ventricle, overlaid with maximum intensity projection of Brainbow-labeled clones representing 165μm. Rostral is up. White dashed box indicates region shown zoomed and rotated in D. D) Series of time points of hindbrain from C taken at 30 min intervals (maximum intensity projections of 30μm). Over a period of 8h, the purple clone can be observed first undergoing mitosis (indicated by white arrowheads), before undergoing progressive whole-clone apoptosis (apoptotic events indicated by white “X”). Throughout this stepwise apoptotic process, nearby labeled cells appear healthy. Rostral is to the right. Scale bar represents 20μm in B, 30μm in C and 20μm in D. E) Number of cell deaths from in vivo time-lapse movies, categorized as isolated cell death, partial-clone apoptosis, or whole-clone apoptosis (n=30 deaths). The majority of deaths observed (19/30) are clonal. F) Mean time elapsed between mitosis and apoptosis, for isolated cell deaths (n=6 cells from 3 fish) and the first death in clonal apoptosis sequence (n=4 cells from 3 fish); error bars represent standard deviation; p < 0.05. In all Brainbow images, dTomato is coded as red, YFP is coded as green, and CFP is coded as blue. |
Reprinted from Developmental Biology, 453(2), Brockway, N.L., Cook, Z.T., O'Gallagher, M., Tobias, Z.J.C., Gedi, M., Carey, K.M., Unni, V.K., Pan, Y.A., Metz, M.R., Weissman, T.A., Multicolor lineage tracing using in vivo time-lapse imaging reveals coordinated death of clonally related cells in the developing vertebrate brain, 130-140, Copyright (2019) with permission from Elsevier. Full text @ Dev. Biol.