
Fig. 4
- ID
- ZDB-FIG-190821-41
- Publication
- Helker et al., 2019 - Whole organism small molecule screen identifies novel regulators of pancreatic endocrine development
- Other Figures
- All Figure Page
- Back to All Figure Page
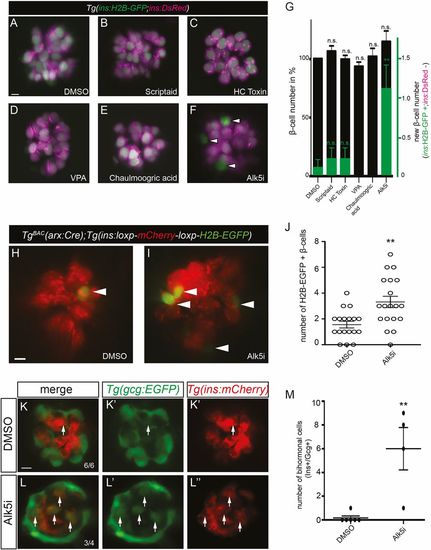
Alk5 inhibition increases β-cell mass by transdifferentiation of α-cells to β-cells.(A-F) Confocal images of 120 hpf Tg(ins:H2B-GFP;ins:DsRed) larvae used to count β-cells. Tg(ins:H2B-GFP;ins:dsRED) larvae treated with DMSO (A), scriptaid (B), HC toxin (C), VPA (D), chaulmoogric acid (E) or Alk5i (F) from 72 to 120 hpf. Newly differentiated β-cells, labeled by H2B-GFP expression but negative for DsRed expression, are marked by arrowheads. (G) None of the treatments leads to a significant increase in total β-cell numbers. Alk5 inhibition leads to an increase of newly differentiated β-cells. (H,I) Confocal images of 120 hpf TgBAC(arx:Cre);Tg(insulin:loxP:mCherrySTOP:loxP:H2B-GFP) larvae used to count α-cell-derived β-cells (arrowheads). (J) Alk5 inhibition leads to an increased number of H2B-EGFP positive β-cells. (K-L″) Confocal images of 120 hpf Tg(gcg:EGFP); Tg(insulin:mCherry) larvae used to count bihormonal endocrine cells (arrows). (M) Alk5 inhibition leads to an increased number of bihormonal endocrine cells. n.s., not significant. **P≤0.01. Error bars represent s.e.m. Scale bars: 5 µm (A,H); 7 µm (K).
|