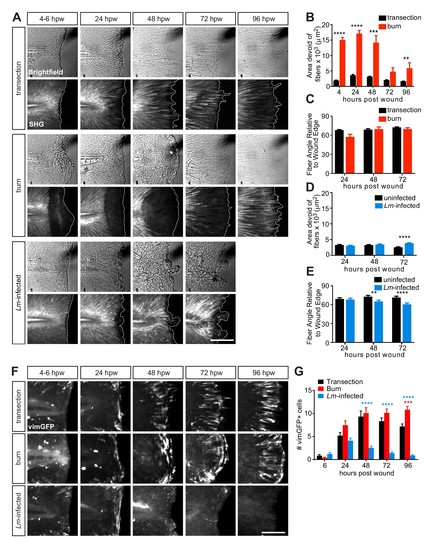
(A) Z-projections of caudal fins imaged at different times after transection, thermal injury (burn) or infected transection showing the tissue wound edge in the bright field and corresponding SHG image. White dotted outline indicates wound edge from brightfield image. Scale bar is 100 microns. (B) Graph showing the area devoid of SHG fibers (from fiber ends to wound edge) following transection or thermal injury. Values are arithmetic means and SE from three biological replicates. p values obtained by analyzing ranks due to residuals not being normally distributed. Total N = 23–28 larvae per time point for each treatment. (C) Graph showing the angle of fiber segments relative to the wound edge, as quantified by CurveAlign software (see Materials and methods), within 50 microns of the wound edge with transection or thermal injury. 0o is parallel to the wound edge while 90o is perpendicular to the wound edge. Values are arithmetic means and SE from three experimental replicates. p values obtained by analyzing ranks due to residuals not being normally distributed. Total N = 14–25 larvae per time point for each treatment. (D) Graph showing the area devoid of SHG fibers (from fiber ends to wound edge) following uninfected or Lm-infected transection. Values are least square means and SE from three biological replicates, with associated p values. Total N = 28-32 larvae per time point for each treatment. (E) Graph showing the angle of fiber segments relative to the wound edge in uninfected or Lm-infected transections. Values are least square means and SE from three biological replicates, with associated p values. Total N = 17–31 larvae per time point for each treatment. **p<0.01, ***p<0.001, ****p<0.0001. (F) Z-projections of multiphoton microscopy images of vimGFP-positive cells at the wound edge in caudal fins at different times after simple transection, burn or Lm-infected transection. Scale bars are 100 microns. Merge of z-projections of vimGFP-positive cell images (green) with z-projections of corresponding SHG images (white) are shown in Figure 3—figure supplement 1B. (G) Graph showing the number of vimGFP-positive cells within a 50 × 100 micron box adjacent to the wound edge and centered vertically with the notochord (Figure 4—figure supplement 1A). Values are least square means and SE from three biological replicates, with associated p values. Total N = 19–28 larvae per time point for each treatment. For clarity, only relevant comparisons (burn in red, or Lm-infected transection in blue, to the control transection) are shown on the graph; ***p<0.001, ****p<0.0001.