
Fig. 2
- ID
- ZDB-FIG-190815-40
- Publication
- Miskolci et al., 2019 - Distinct inflammatory and wound healing responses to complex caudal fin injuries of larval zebrafish
- Other Figures
- All Figure Page
- Back to All Figure Page
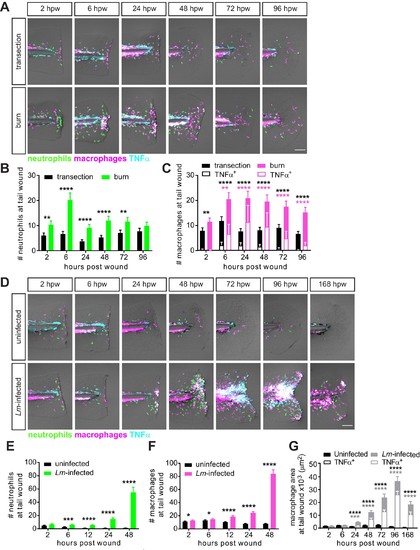
Caudal fin injuries trigger distinct inflammatory responses.(A) Sum-projections of z-stacks acquired by laser scanning confocal microscope using triple transgenic larvae (Tg(tnf:GFP) x Tg(lysC:BFP/mpeg1:mCherry-CAAX)) over time in response to simple transection or thermal injury. Merged channels are displayed; single channels are shown in Figure 2—figure supplement 1. Scale bar is 100 microns. Leukocyte recruitment was quantified by counting (B) neutrophils and (C) macrophages in the caudal fin tissue distal to the caudal artery/vein loop (Figure 1A). In parallel, TNFα expression in macrophages was monitored using TNFα reporter and scored as negative or positive for expression, and TNFα-positive counts are shown in (C). Values in (B) and (C) are least square means and SE from four biological replicates, with associated p values. Total N = 28–44 larvae per time point for each treatment. **p<0.01, ****p<0.0001; black and magenta * depict p values for leukocyte and TNFα-positive counts, respectively. p values for comparing time points within each injury are provided in Figure 2—figure supplement 2A,B. (D) Sum-projections of z-stacks acquired by laser scanning confocal microscope using triple transgenic larvae (Tg(tnf:GFP) x Tg(lysC:BFP/mpeg1:mCherry-CAAX)) over time in response to uninfected or Lm-infected transection. Merged channels are displayed; single channels are shown in Figure 2—figure supplement 3. Scale bar is 100 microns. Leukocyte recruitment was quantified using double transgenic larvae (Tg(lysC:mCherry-histone2b) x Tg(mpeg1:GFP-histone2b)) where (E) neutrophils and (F) macrophages were counted in caudal fin area distal to the caudal artery/vein loop in single-plane images acquired by Zeiss Zoomscope. TNFα expression in macrophages (G) was quantified by area thresholding (see Materials and methods and Figure 2—figure supplement 2E) using images in (D). For clarity, values in (G) for the uninfected transection are also shown separately in Figure 2—figure supplement 2F. Values in (E) and (F) are least square means and SE from four biological replicates, with associated p values. Values for macrophages were fitted with poisson distribution. Total N = 30–60 larvae per time point for each treatment. *p<0.05, ***p<0.001, ****p<0.0001. Values in (G) are arithmetic means and SE from three experimental replicates with associated p values obtained by analyzing ranks due to residuals not being normally distributed. Total N = 12–27 larvae per time point for each treatment. ***p<0.001, ****p<0.0001; black and gray * depict p values for macrophage and TNFα-positive areas, respectively. |
| Fish: | |
|---|---|
| Conditions: | |
| Observed In: | |
| Stage Range: | Protruding-mouth to Days 7-13 |