
Fig. 7
- ID
- ZDB-FIG-190813-9
- Publication
- Princely Abudu et al., 2019 - NIPSNAP1 and NIPSNAP2 Act as "Eat Me" Signals for Mitophagy
- Other Figures
- All Figure Page
- Back to All Figure Page
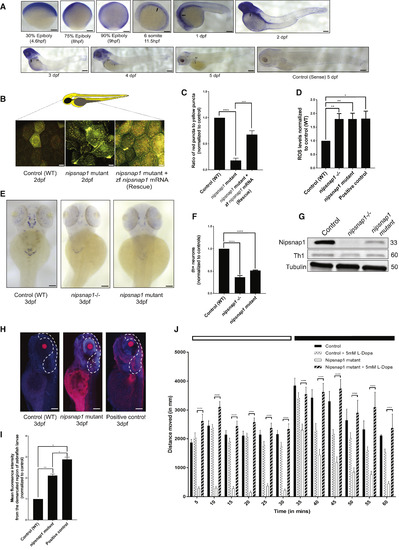
Nipsnap1-Deficient Zebrafish Larvae Display Parkinsonism (A) Spatial expression pattern of nipsnap1 across different development stages of zebrafish as demonstrated by whole-mount in situhybridizations. All embryos are in lateral view. Scale bar is 200 μm. (B) Representative images of control (WT), nipsnap1 mutant, and rescue (nipsnap1 mutant + zebrafish nipsnap1 mRNA) transgenic tandem-tagged mitofish larvae at 3 dpf. Images are from head region of zebrafish larvae. Scale bars are 20 μm. (C) Quantification of ratio of red puncta to yellow puncta (representative of mitophagy) per cell. Average of 15 cells from each of 25 larvae for control (WT), nipsnap1 mutant, and nipsnap1 mutant + rescue; tandem-tagged mitofish larvae from three independent experiments were used for quantification. (D) Control (WT), nipsnap1−/− and nipsnap1 mutant embryos at 3 dpf incubated with CellROX and ROS levels quantified from six different experiments. Error bars represent ± SEM. (E) Spatial expression pattern of tyrosine hydroxylase 1 (th1) gene in control (WT), nipsnap1−/− and nipsnap1 mutant embryos at 3 dpf determined by whole-mount in situ hybridization. Orientation dorsal. Scale bar is 200 μm. (F) Quantification of the number of Th1 positive neurons from images in (D). 10 control (WT), 20 mutant and 20 knockout larvae were used for quantification. Values were normalized to control (WT) values. (G) Representative immunoblots of Nipsnap1, Th1, and β-tubulin on whole embryo lysates of WT, nipsnap1−/− and nipsnap1 mutant embryos at 3 dpf. β-tubulin served as loading control. (H) Representative images of TUNEL assay on control (WT), nipsnap1mutant and DNase-treated WT larvae (positive control) at 3dpf. Orientation lateral. Scale bar is 200 μm. (I) Quantification of mean fluorescent intensity from demarcated region from images in (H). 10 control (WT), 15 nipsnap1 mutant, and 10 positive control larvae were used for quantification, respectively. Values were normalized to control (WT) values. (J) Motility analysis of WT and nipsnap1 mutant embryos at 7 dpf using the “Zebrabox” automated videotracker (Viewpoint, Lyon). Assay was carried out during daytime, one cycle of 20 min exposure to light (white horizontal bar) followed by 20 min of darkness (black horizontal bar). Vertical bars indicate average distance moved during 5 min intervals. Controls and nipsnap1 mutants were treated or not with 5 mM of L-DOPA for 1 h, after which they were analyzed for motility. Each group consisted of 20–24 larvae. All error bars indicate SEM. ∗p < 0.05, ∗∗p < 0.005, ∗∗∗p < 0.0005, ∗∗∗∗ p < 0.00005, unpaired Student’s t test |
| Genes: | |
|---|---|
| Antibody: | |
| Fish: | |
| Knockdown Reagents: | |
| Anatomical Terms: | |
| Stage Range: | 30%-epiboly to Day 5 |
| Fish: | |
|---|---|
| Condition: | |
| Knockdown Reagents: | |
| Observed In: | |
| Stage Range: | Protruding-mouth to Days 7-13 |
Reprinted from Developmental Cell, 49(4), Princely Abudu, Y., Pankiv, S., Mathai, B.J., Håkon Lystad, A., Bindesbøll, C., Brenne, H.B., Yoke Wui Ng, M., Thiede, B., Yamamoto, A., Mutugi Nthiga, T., Lamark, T., Esguerra, C.V., Johansen, T., Simonsen, A., NIPSNAP1 and NIPSNAP2 Act as "Eat Me" Signals for Mitophagy, 509-525.e12, Copyright (2019) with permission from Elsevier. Full text @ Dev. Cell