
Fig. 1
- ID
- ZDB-FIG-190809-9
- Publication
- Lin et al., 2019 - Identification of Novel Anti-Liver Cancer Small Molecules with Better Therapeutic Index than Sorafenib via Zebrafish Drug Screening Platform
- Other Figures
- All Figure Page
- Back to All Figure Page
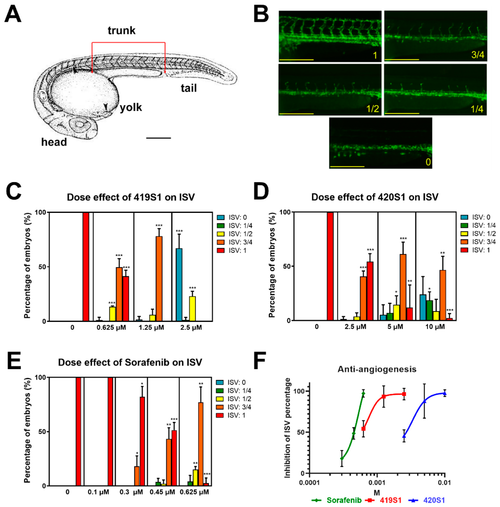
Titrations of 419S1, 420S1, and Sorafenib, and determination of the half maximal inhibitory concentration (IC50) for anti-angiogenesis. (A) Schematic illustration of the zebrafish embryo at two days post fertilization (dpf), indicating the trunk region for measuring the length of intersegmental vessels (ISVs). (B) Representative images of the 2 dpf embryos exposed to compounds for one day with the lengths of ISVs reaching the dorsal longitudinal anastomotic vessel (DLAV) fully (1), three quarters (3/4), halfway (1/2), one-quarter (1/4), or none (0). Scale bar of A and B: 0.2 mm. (C) Bar chart (mean and S.E.M.) showing a significant reduction in the length of ISVs after one day immersion with 419S1 at three concentrations (0.625, 1.25, and 2.5 μM). (D) Quantification of ISVs showed a significant inhibition of angiogenesis after 420S1 treatment at three concentrations (2.5, 5, and 10 μM). (E) Exposure to Sorafenib lead to a significant reduction in the length of ISVs at four concentrations (0.1, 0.3, 0.45, and 0.625 μM). (F) The dose-response fitting curve of 419S1, 420S1, and Sorafenib was generated by Prism8 (GraphPad Software, San Diego, CA, USA). Inhibition of ISV percentage is the percentage of embryos combined with all form of shortened ISVs. *: 0.01 < p ≤ 0.05; **: 0.001 < p ≤ 0.01; ***: p ≤ 0.001. |
| Fish: | |
|---|---|
| Conditions: | |
| Observed In: | |
| Stage: | Long-pec |