
Fig. 2
- ID
- ZDB-FIG-190809-10
- Publication
- Lin et al., 2019 - Identification of Novel Anti-Liver Cancer Small Molecules with Better Therapeutic Index than Sorafenib via Zebrafish Drug Screening Platform
- Other Figures
- All Figure Page
- Back to All Figure Page
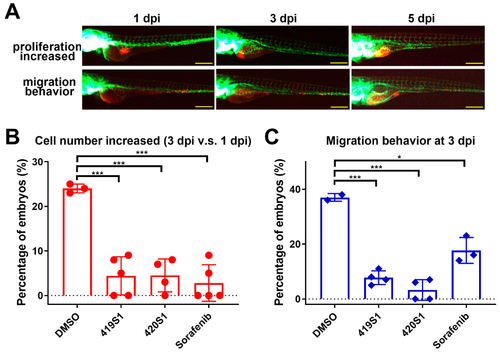
419S1, 420S1, and Sorafenib exhibit anti-proliferation and anti-migration abilities in a xenotransplantation assay. (A) Schematic diagrams of proliferation and migration changes at one, three, and five days post-injection (dpi). The red fluorescence was the CM-DiI-labeled 293T cells overexpressing EDN1 oncogene microinjected into 2 dpf Tg(fli:EGFP) zebrafish embryos where blood vessels express green fluorescence. One dpi images of embryos carrying 293T/EDN1 were captured, compounds were added to the solution, and images of embryos were captured two days after drug treatment at three dpi, or four days of drug treatment at five dpi. Scale bar: 0.2 mm. (B) Dot-plot (mean and S.E.M.) showing 419S1, 420S1, and Sorafenib treatment significantly decreased the percentage of embryos with tumor cell proliferation. (C) Dot-plot (mean and S.E.M.) showing 419S1, 420S1, and Sorafenib treatment significantly decreased the percentage of embryos with tumor cell migration behavior compared to the dimethyl sulfoxide (DMSO) control. *: 0.01 < p ≤ 0.05; **: 0.001 < p ≤ 0.01; ***: p≤ 0.001. |