
Fig. 2
- ID
- ZDB-FIG-190808-4
- Publication
- Cosacak et al., 2019 - Single-Cell Transcriptomics Analyses of Neural Stem Cell Heterogeneity and Contextual Plasticity in a Zebrafish Brain Model of Amyloid Toxicity
- Other Figures
- All Figure Page
- Back to All Figure Page
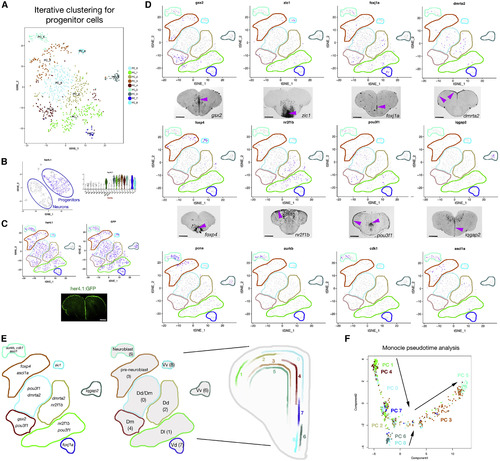
Identification of PC Types (A) tSNE plots for PC clusters. (B) her4.1 expression in a tSNE (left) and violin plot (VLN) of single cell data (right), which contain all cell types. (C) her4.1 expression (left) and GFP expression (right), shown in tSNE plots for PCs. Also shown is her4.1-driven GFP staining on a telencephalon section (bottom). (D) tSNE plots for some of the marker genes and relevant in situ hybridizations. Pink arrowheads denote expression domains. (E) Marker genes and localization of cell types on a representative telencephalic scheme. (F) Cell trajectories on pseudotime generated by monocle2; all colors depict the cell cluster colors in (A). Scale bars, 200 μm. See also Figures S1–S3. |