
Fig. 2
- ID
- ZDB-FIG-190801-44
- Publication
- Xu et al., 2019 - Excessive inflammation impairs heart regeneration in zebrafish breakdance mutant after cryoinjury
- Other Figures
- All Figure Page
- Back to All Figure Page
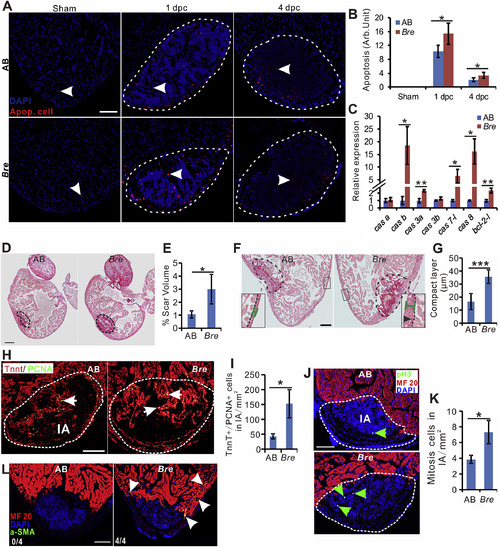
Comparative analysis of cardiac regenerative ability in AB and bremutant zebrafish after heart cryoinjury. (A). Representative TUNEL staining sections of AB and bre mutant zebrafish indicating the apoptotic cells (red, white arrow) in the injured area (bounded by the white dashed line) of the heart at 1 dpc and 4 dpc, and whole ventricle of sham-operated zebrafish. Scale bar: 100 μm. (B). Bar chart shows the quantification of apoptotic cells (n = 3–6) in panel (A) was significantly different at p < 0.05 (*), two tail t-test. (C) qRT-PCRanalysis expression levels of apoptotic cytokine in AB and bre mutant heart at 4 dpc. The asterisk indicates significant difference observed at p < 0.05 (*) and p < 0.01 (**) between AB and bre mutant zebrafish, n = 3, two tail t-test. (D-G) Representative picrosirus red staining paraffin sections of AB and bre mutant zebrafish heart displaying scar volume (D) and thickness of compact layer (F) at 30 dpc. The black dashed line indicates the injured scar area. Black arrowhead(F) indicates the fibrotic subepicardial layer in bre mutant zebrafish. Scale bar: 100 μm. Bar chart (E, G) shows the quantification of the percentage of scar volume in panel D and thickness of the epicardial layer in panel F was significantly different between AB and bre mutant at p < 0.05 (*) (n = 5), two tail t-test. (H) Representative images of immunofluorescent labeling of cardiomyocyte (red) and PCNA (green) in the injured area of AB and bre mutant zebrafish at 7 dpc. White arrow indicates the double positive TnnT+/PCNA+cells in the injured area (IA). Scale bar: 100 μm. (I). Bar chart shows the quantification of double positive TnnT+/PCNA+ (n = 4) in panel H, two tail t-test, p < 0.05 (*). (J). Representative images of immunofluorescent labeling of mitotic cells (green, green arrowhead) in the injured area of AB and bre mutant zebrafish at 7 dpc. Scale bar: 100 μm. (K). Bar chart shows the quantification of mitotic cells (n = 4) in panel J, two tail t-test, p < 0.05 (*). (L). Representative images of immunofluorescent labelling of α-SMA (green, white arrowhead) in the heart of AB (n = 4) and bre mutant (n = 4) zebrafish. |