
Fig. 3
- ID
- ZDB-FIG-190801-38
- Publication
- Yamamoto et al., 2019 - ZF-Mapper: Simple and Complete Freeware for Fluorescence Quantification in Zebrafish Images
- Other Figures
- All Figure Page
- Back to All Figure Page
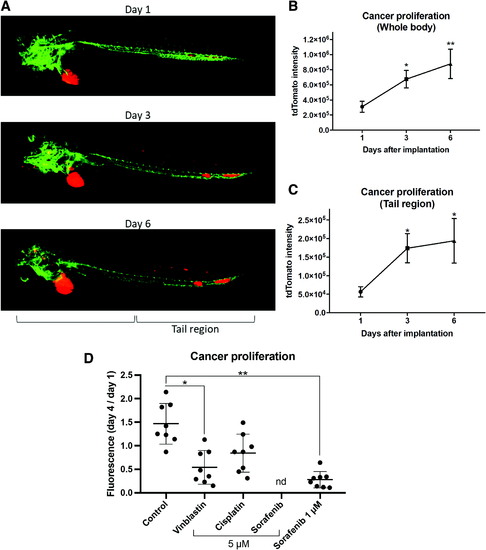
ZF-Mapper analysis for cancer xenograft zebrafish. (A) Typical images of tdTomato-labeled A375 xenograft zebrafish from day 1 to day 6 after cell implantation. (B) Whole-body tdTomato fluorescence as quantified using ZF-Mapper. (C) tdTomato fluorescence in the posterior half of zebrafish, that is, the tail region. n = 8, *p < 0.05, **p < 0.01 versus day 1. Error bars indicate standard error of the mean. (D) ZF-Mapper analysis for anticancer drug treatment of melanoma xenografts. Fluorescence intensities of the implanted A375-tdTomato were quantified using ZF-Mapper and calculated as the ratio for day 1/day 4 cell proliferation. n = 8, *p < 0.05, **p < 0.01 versus day 1. Error bars indicate standard deviation, and “nd” indicates no fish survived with 5 μM sorafenib. Color images are available online. |