
Fig. 1
- ID
- ZDB-FIG-190731-15
- Publication
- Rueda et al., 2019 - The Hippo Pathway Blocks Mammalian Retinal Müller Glial Cell Reprogramming
- Other Figures
- All Figure Page
- Back to All Figure Page
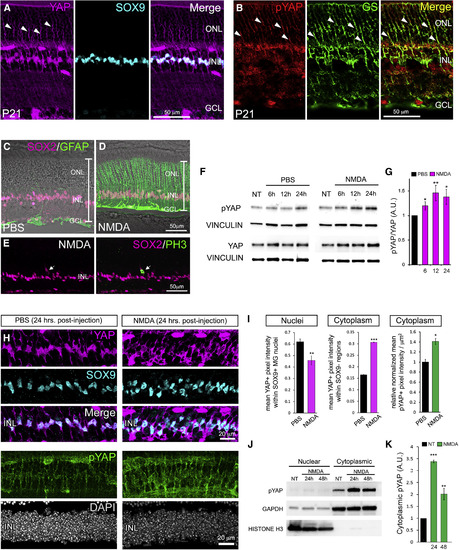
Negative Regulation of YAP in Response to Retinal Damage (A) P21 retinal immunofluorescence with an antibody against total YAP and Müller glial cell (MG) nuclear marker SOX9. (B) Labeling with an antibody specific to phosphorylated YAP (pYAP) and MG marker glutamine synthetase (GS). (C and D) Immunofluorescence for MG markers SOX2 (magenta) and GFAP (green) 48 h after intraocular injection of PBS or N-methyl-D-aspartate (NMDA). (E) SOX2/PH3 immunofluorescence 48 h after NMDA injection. (F and G) Time course western blots (F) and quantification (G; normalized to vinculin) of pYAP and YAP after NMDA injection. (H and I) YAP (magenta)/SOX9 (cyan) and pYAP immunofluorescence (green) (H) and quantification (I) 24 h post-NMDA. (J and K) Cell fraction time course western blots (J) and quantification (K) of YAP and pYAP 24 and 48 h post-NMDA. For western blots, levels are given as a.u. ± SEM relative to PBS or no-treatment (NT) controls harvested at the 6-h time point (set to 1) (n = 3 independent pooled samples per group; Student’s t test). For pixel intensity measurements, levels are given as mean ± SEM (n = 3 per group; Wilcoxon rank-sum test). ∗p ≤ 0.05, ∗∗p ≤ 0.01, ∗∗∗p ≤ 0.001. |