
FIGURE
Fig. S2
Fig. S2
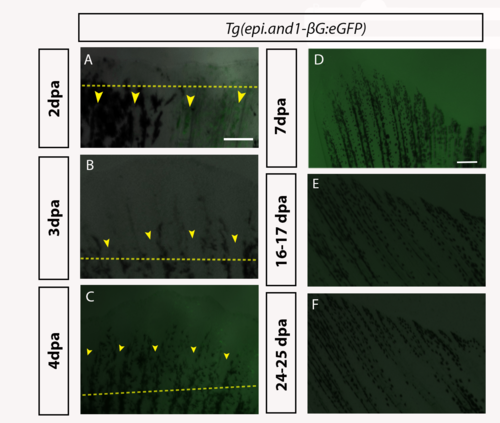
Time course analysis of eGFP in Tg(epi.and1-βG:eGFP) throughout regeneration.Regenerative time course analysis of in vivo reporter expression of Tg(epi.and1-βG:eGFP) (n = 25 fish/line, 2 lines) at 2dpa (A), 3dpa (B), 4dpa (C), 7dpa (D), 16-17dpa (E) and 24-25dpa (F). (A-F) There is a complete absence of reporter expression throughout regeneration. All scale bars = 200μm. |
Expression Data
Expression Detail
Antibody Labeling
Phenotype Data
Phenotype Detail
Acknowledgments
This image is the copyrighted work of the attributed author or publisher, and
ZFIN has permission only to display this image to its users.
Additional permissions should be obtained from the applicable author or publisher of the image.
Full text @ PLoS One