|
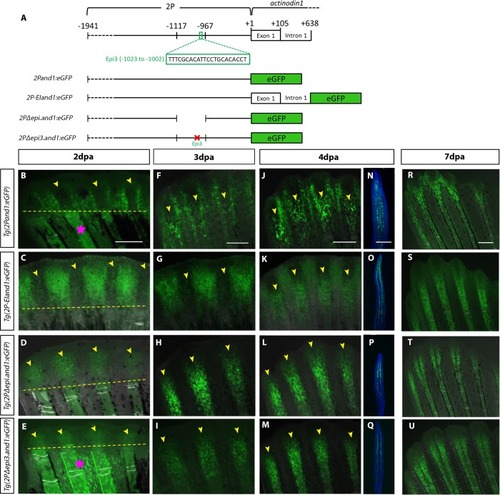
The <italic>epi3</italic> site within the <italic>epi</italic> region contains a mesenchymal-specific repressor that is active early in regeneration.(A) Schematic representation of constructs. In vivo time course analysis of reporter expression in Tg(2Pand1:eGFP) (n = 7) (B, F, J, R), Tg(2P-EIand1:eGFP) (n = 12) (C, G, K, S), Tg(2PΔepi.and1:eGFP) (n = 11) (D, H, L, T), and Tg(2PΔepi3.and1:eGFP) (n = 13) (E, I, M, U) during fin regeneration. Fluorescent images are merged with bright field images. (N-Q) Immunostaining for eGFP on longitudinal cryosections of 4dpa fin regenerates. (B-E) At 2dpa, Tg(2Pand1:eGFP) and Tg(2P-EIand1:eGFP) only have interray epithelial-specific expression while Tg(2PΔepi.and1:eGFP), and Tg(2PΔepi3.and1:eGFP) have fin ray mesenchymal-specific expression. (F, G) At 3dpa, Tg(2Pand1:eGFP) and Tg(2P-EIand1:eGFP) have bright interray epithelial-specific expression and faint fin ray mesenchymal-specific expression. (H, I, L, M) In Tg(2PΔepi.and1:eGFP) and Tg(2PΔepi3.and1:eGFP), strong fin ray mesenchymal-specific expression is observed. (J, N, R) At 4dpa and 7dpa, fin ray mesenchymal- and basal epithelial-specific expression in Tg(2Pand1:eGFP) is faint and patchy. (K-M, O-Q, S-U) Reporter expression in Tg(2P-EIand1:eGFP) is bright in the interray, while fin ray mesenchymal-specific expression is just as bright as that of Tg(2PΔepi.and1:eGFP) and Tg(2PΔepi3.and1:eGFP). Time course analysis was done on one line for each construct; n = # of fish/ line. Pink stars in B and E indicate autofluorescence from white pigment cells and blood vessels. Yellow arrowheads indicate fin ray regenerative tissue. Amputation plane is delineated by yellow dotted line. Scale bars = 200μm.
|