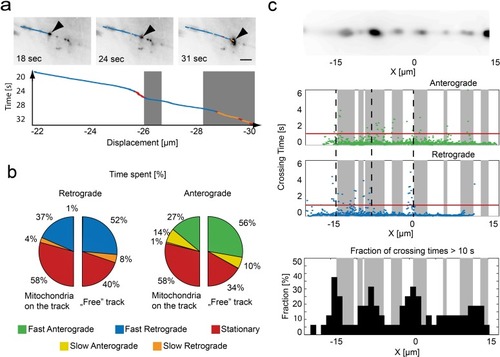
Relation of mitochondrial trajectory to local axonal environment.
(a) Mapping of the trajectory of a single mitochondrion (black arrow) onto the inverted wide-field images (scale bar, 5 µm). Bottom panel, kymograph color coded according to motion state, location of stationary mitochondria depicted in gray. (b) Pie charts indicating the fraction of time spent in each motion state related to the local presence or absence of a mitochondrion in retrograde (left) or anterograde (right) direction (n = 16 trajectories, nine fish). (c) Repetitive tracking of mitochondria over the same stretch of an axon. Upper Panel: Wide field image of the ROI showing the location of stalled mitochondria on a section of microtubules. Middle panel: The time a mitochondrion needed to transverse 100 nm is plotted as a function of position along the axon. Gray boxes indicate the presence of stationary mitochondria. The red line indicates the threshold level to identify bins of slow movement. Dashed black lines indicate locations where multiple mitochondria were observed to pause (see lower panel). Lower panel: Fraction of trajectories (plotted in 1 µm bins from mitochondria moving in both directions) along the axon showing crossing times of more than 10 s for 1 µm.
10.7554/eLife.46059.021
Matlab files for analyzing and producing graphics of pie charts from panel b, crossing time of stationary mitochondria as well as fracrion of trajectories from panel c.
Expression Data
Expression Detail
Antibody Labeling
Phenotype Data
Phenotype Detail
Acknowledgments
This image is the copyrighted work of the attributed author or publisher, and
ZFIN has permission only to display this image to its users.
Additional permissions should be obtained from the applicable author or publisher of the image.
Full text @ Elife
Your Input Welcome
Thank you for submitting comments. Your input has been emailed to ZFIN curators who may contact you if
additional information is required.
Oops. Something went wrong. Please try again later.