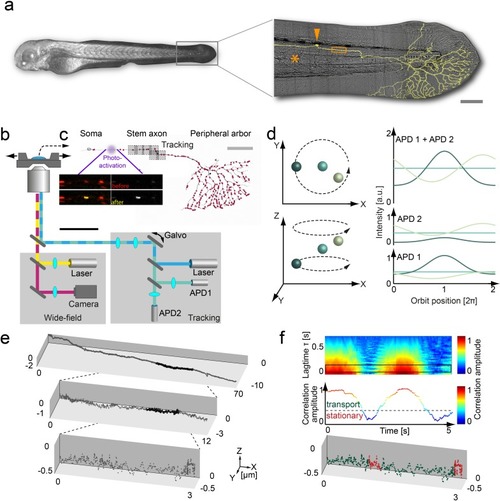
(a) The localization of a stationary particle (190 nm multifluorescent bead, Spherotech) at a countrate of >1600 photons per orbit (i.e. 320 kHz) is shown as a function of time (acquisition rate 200 Hz) for x, y and z in black, dark gray and light gray, respectively. The localization precision, determined from the standard deviation of the position of the stationary particle, was <3 nm laterally and <21 nm axially. (b) The localization precision for a moving particle (with a maximum velocity of 6.2 μm/s). An immobilized particle was moved along a sinusoidal path using a 3-axis piezo stage and the position recorded as a function of time (acquisition rate, 200 Hz) in x, y or z shown in black, dark gray and light gray respectively. A sinusoidal fit was performed (green lines) and the standard deviation of the residuals was used to determine the precision. For a count rate of >1600 photons per orbit (i.e. 320 kHz), a localization precision of <3 nm laterally and 21 nm axially was measured. (c) Count-rate dependent localization precision (average values from stationary and dynamic particles, acquisition rate 200 Hz). The values for x, y and z are shown in black, dark gray and light gray, respectively. (d) Velocity-dependent localization precision for a particle moving along the x, y and z axes. The decreased accuracy of the x axis compared to the y axis at velocities above 5 μm/s is a result of a ~ 0.1 ms delay in updating the position of the particle at the starting point of the new orbit (ϕ = 0°). (e) To measure the in vivo localization precision of the orbital tracking approach, a stationary mitochondrion inside the zebrafish was tracked at a count rate of 500 photons per orbit (i.e. 100 kHz). The trajectory data along the x axis (minor axis of the mitochondria) shows a localization precision of ~21 nm. (f) To determine the dynamic localization precision, the stationary mitochondrion was externally moved along the minor axis using a piezo stage. Similar to the dynamic precision measurement using beads, the resulting trajectory was fit using a sine wave and the standard deviation of the residuals showed a localization precision of 42 nm. The localization precision for moving mitochondria, which are usually smaller than stationary ones, was estimated from the standard deviation of the y orbit displacement, which averages 4.6 nm after removing high frequency noise by smoothing the trajectory data by five points.
10.7554/eLife.46059.004
Matlab and data files for analyzing and producing graphics for particle localization from panels a-f.
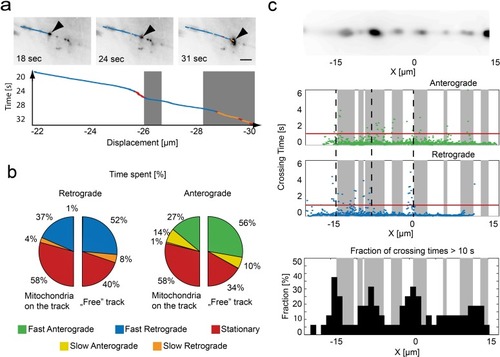
Relation of mitochondrial trajectory to local axonal environment.
(a) Mapping of the trajectory of a single mitochondrion (black arrow) onto the inverted wide-field images (scale bar, 5 µm). Bottom panel, kymograph color coded according to motion state, location of stationary mitochondria depicted in gray. (b) Pie charts indicating the fraction of time spent in each motion state related to the local presence or absence of a mitochondrion in retrograde (left) or anterograde (right) direction (n = 16 trajectories, nine fish). (c) Repetitive tracking of mitochondria over the same stretch of an axon. Upper Panel: Wide field image of the ROI showing the location of stalled mitochondria on a section of microtubules. Middle panel: The time a mitochondrion needed to transverse 100 nm is plotted as a function of position along the axon. Gray boxes indicate the presence of stationary mitochondria. The red line indicates the threshold level to identify bins of slow movement. Dashed black lines indicate locations where multiple mitochondria were observed to pause (see lower panel). Lower panel: Fraction of trajectories (plotted in 1 µm bins from mitochondria moving in both directions) along the axon showing crossing times of more than 10 s for 1 µm.
10.7554/eLife.46059.021
Matlab files for analyzing and producing graphics of pie charts from panel b, crossing time of stationary mitochondria as well as fracrion of trajectories from panel c.
Acknowledgments
This image is the copyrighted work of the attributed author or publisher, and
ZFIN has permission only to display this image to its users.
Additional permissions should be obtained from the applicable author or publisher of the image.
Full text @ Elife
Your Input Welcome
Thank you for submitting comments. Your input has been emailed to ZFIN curators who may contact you if
additional information is required.
Oops. Something went wrong. Please try again later.