
Figure 8.
- ID
- ZDB-FIG-190723-874
- Publication
- Ding et al., 2019 - Computational 3D histological phenotyping of whole zebrafish by X-ray histotomography
- Other Figures
-
- Figure 1—figure supplement 2.
- Figure 1—figure supplement 3.
- Figure 2.
- Figure 3—figure supplement 1.
- Figure 3—figure supplement 1.
- Figure 4.
- Figure 5—figure supplement 1.
- Figure 5—figure supplement 1.
- Figure 6.
- Figure 7—figure supplement 1.
- Figure 7—figure supplement 1.
- Figure 7—figure supplement 2.
- Figure 8.
- Figure 9.
- All Figure Page
- Back to All Figure Page
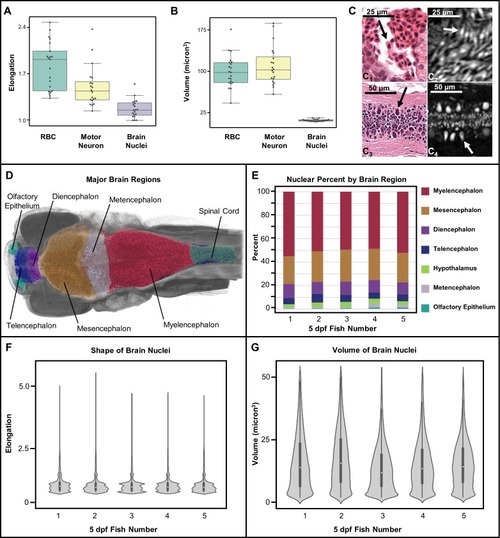
Shape and volume of manually detected brain cell nuclei varies between red blood cells (RBCs) and motor neurons (n = 20 cells each) ( |