
FIGURE
Figure 7—figure supplement 1.
- ID
- ZDB-FIG-190723-865
- Publication
- Ding et al., 2019 - Computational 3D histological phenotyping of whole zebrafish by X-ray histotomography
- Other Figures
-
- Figure 1—figure supplement 2.
- Figure 1—figure supplement 3.
- Figure 2.
- Figure 3—figure supplement 1.
- Figure 3—figure supplement 1.
- Figure 4.
- Figure 5—figure supplement 1.
- Figure 5—figure supplement 1.
- Figure 6.
- Figure 7—figure supplement 1.
- Figure 7—figure supplement 1.
- Figure 7—figure supplement 2.
- Figure 8.
- Figure 9.
- All Figure Page
- Back to All Figure Page
Figure 7—figure supplement 1.
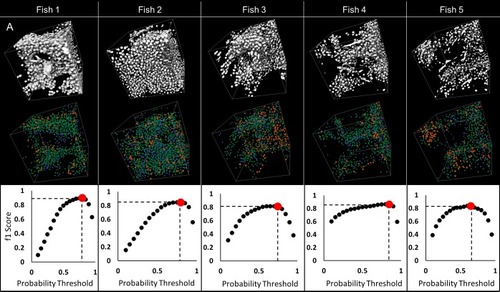
75 × 75×75 µm regions were selected on each fish to validate detection of nuclei: sample regions R1, R2 and R3 are presented ( |
Expression Data
Expression Detail
Antibody Labeling
Phenotype Data
Phenotype Detail
Acknowledgments
This image is the copyrighted work of the attributed author or publisher, and
ZFIN has permission only to display this image to its users.
Additional permissions should be obtained from the applicable author or publisher of the image.
Full text @ Elife